SQL 查询
1 概述
使用 SQL 查询可以实现自由编写 SQL 代码查询项目内所有数据,满足 TapDB 固有分析模型中无法满足的个性化取数、分析需求。
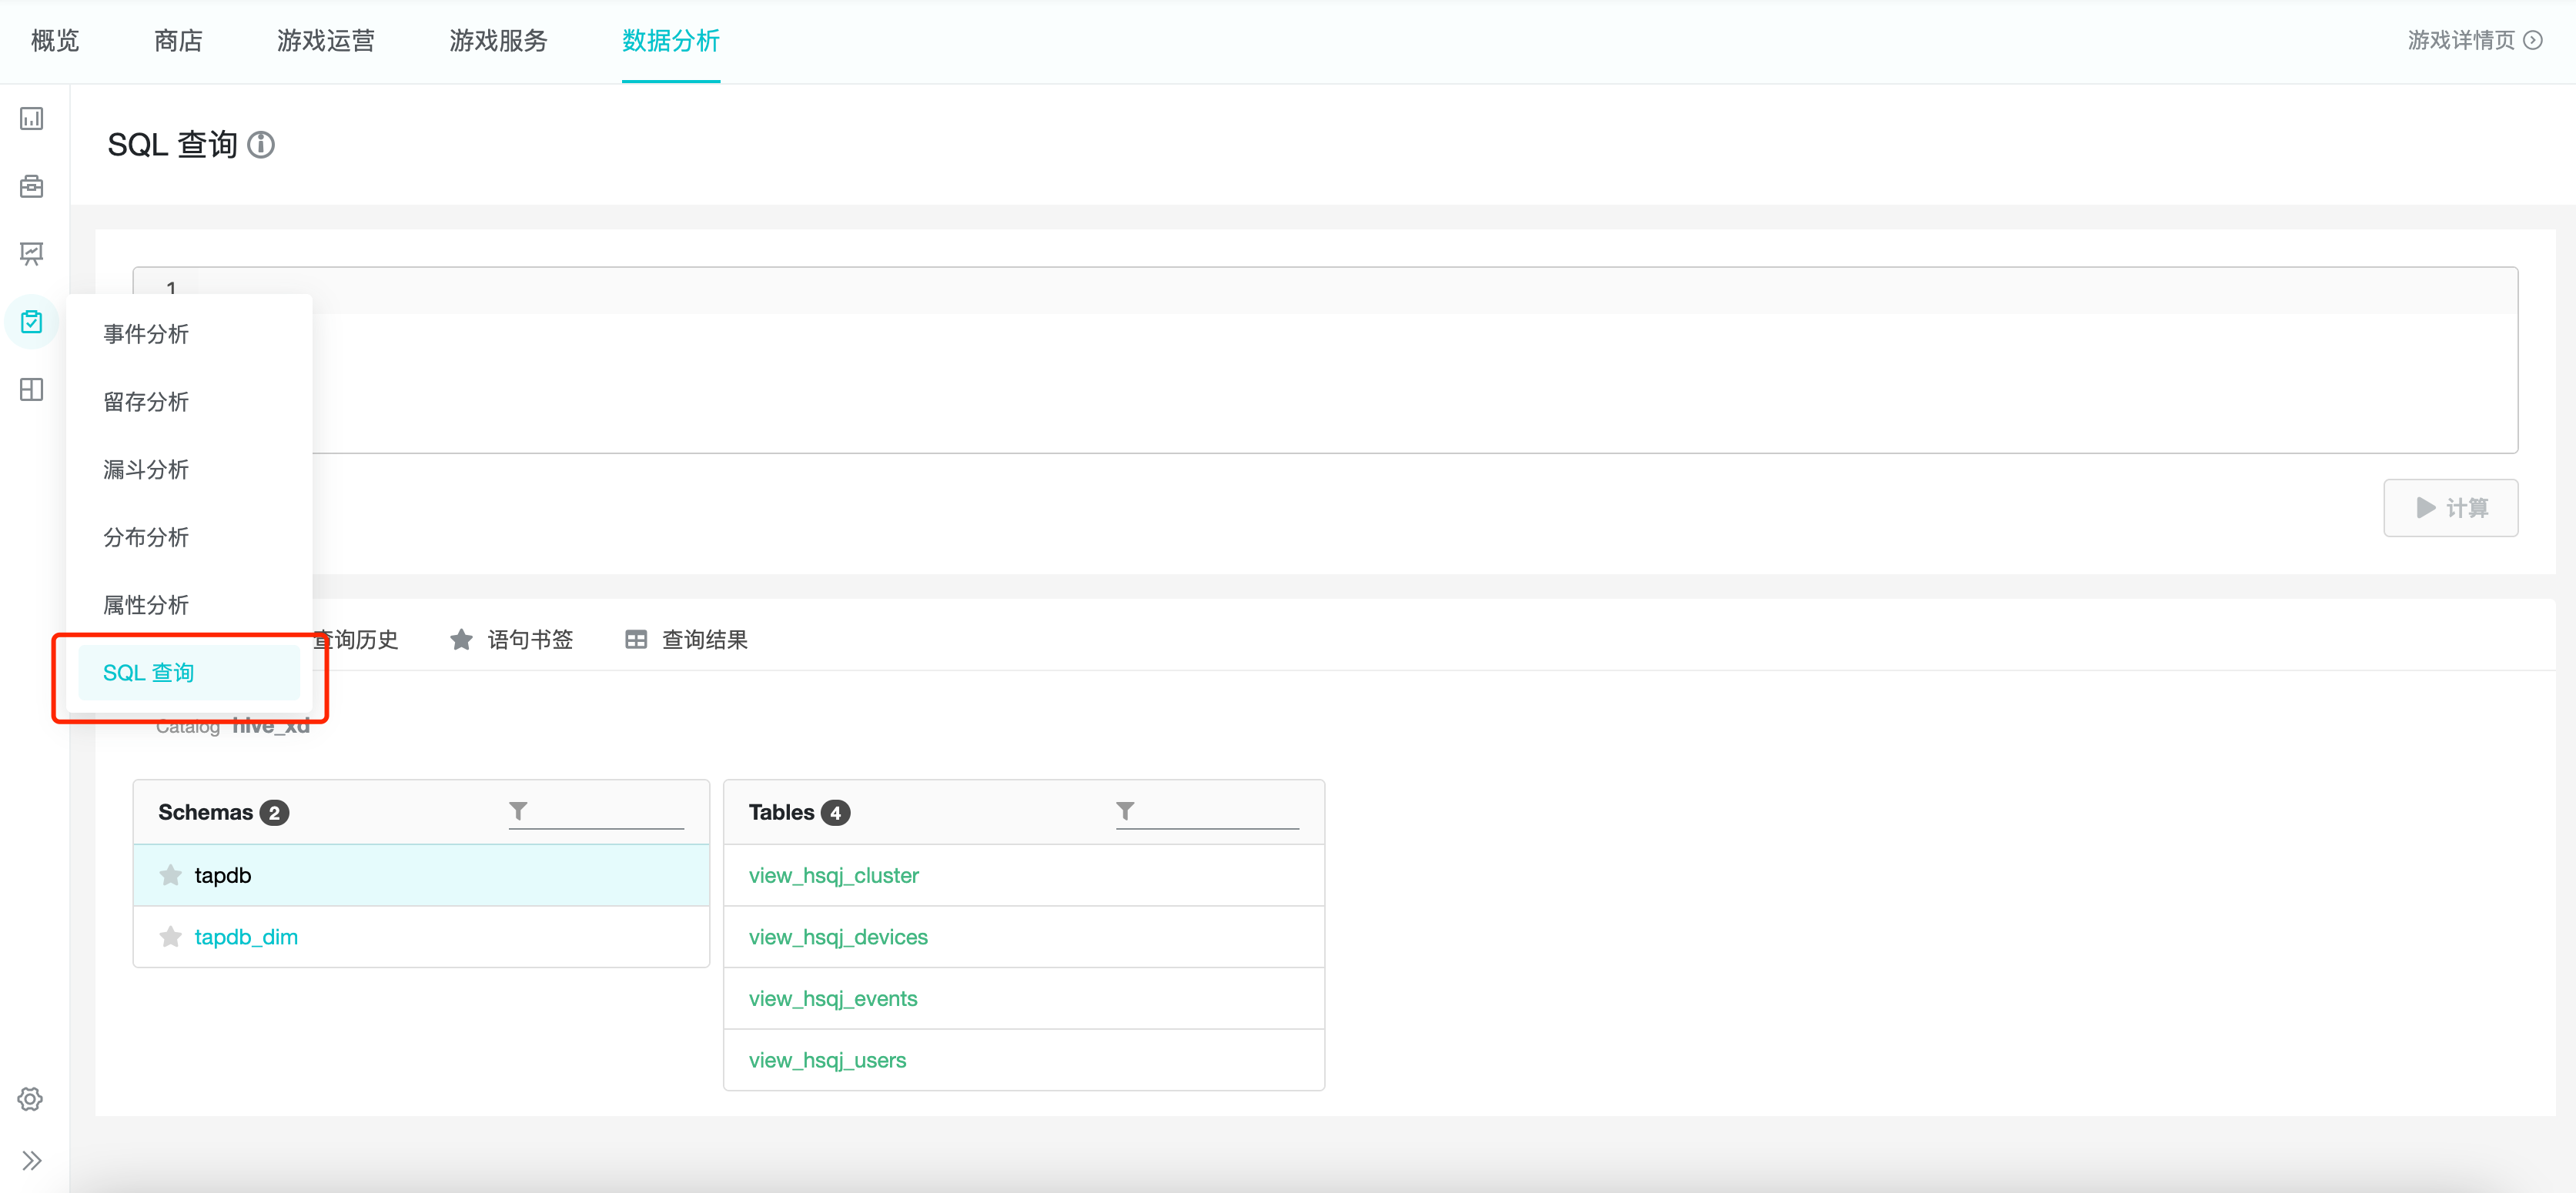
可从「分析」模块下的「SQL 查询」进入 SQL 查询功能,页面由语句「编写框」、「标签页」构成,其中标签页由「表结构」、「查询历史」、「语句书签」和「查询结果」构成。
2 适用角色与用途
| 角色 | 用途 |
|---|---|
| 管理员 / 分析师 | 了解项目当前数据资产。 |
| 分析师 | 自由编写 SQL 查询项目所有数据,满足 TapDB 固有分析模型中无法满足的个性化取数、分析需求。 |
| 业务人员 | 替换分析师 SQL 代码中的动态参数,满足持续取数、分析需求。 |
3 用表范围与注意事项
3.1 用表范围
在 TapDB SQL 查询功能中,可查询库表范围如下:
| 表 | 库名 | 表名 |
|---|---|---|
| 事件表 | tapdb | view_{{项目 ID}}_events |
| 设备表 | tapdb | view_{{项目 ID}}_devices |
| 用户表 | tapdb | view_{{项目 ID}}_users |
| 用户分群表 | tapdb | view_{{项目 ID}}_cluster |
| 维度属性表 | tapdb_dim | view_{{项目 ID}}_{{维度表名}} |
建议通过「数据表列表」中的「复制表名」功能,将复制该表的表名至剪切板后粘贴至语句编写框,详见本文 5.1.2 部分。
3.2 使用用户分群表的注意事项
所有用户分群数据均存储在同一张表 view_{{项目 ID}}_cluster 中。
可通过筛选分群名,并选择相应分群主体字段,得到该分群下的用户 ID,如下:
分群主体为账号的分群:
select
    user_id
from hive.tapdb.view_{{项目 ID}}_cluster
where cluster_name = ‘{{cluster_name}}’
分群主体为设备的分群:
select
    device_id
from hive.tapdb.view_{{项目 ID}}_cluster
where cluster_name = ‘{{cluster_name}}’
4 编写与执行 SQL 语句
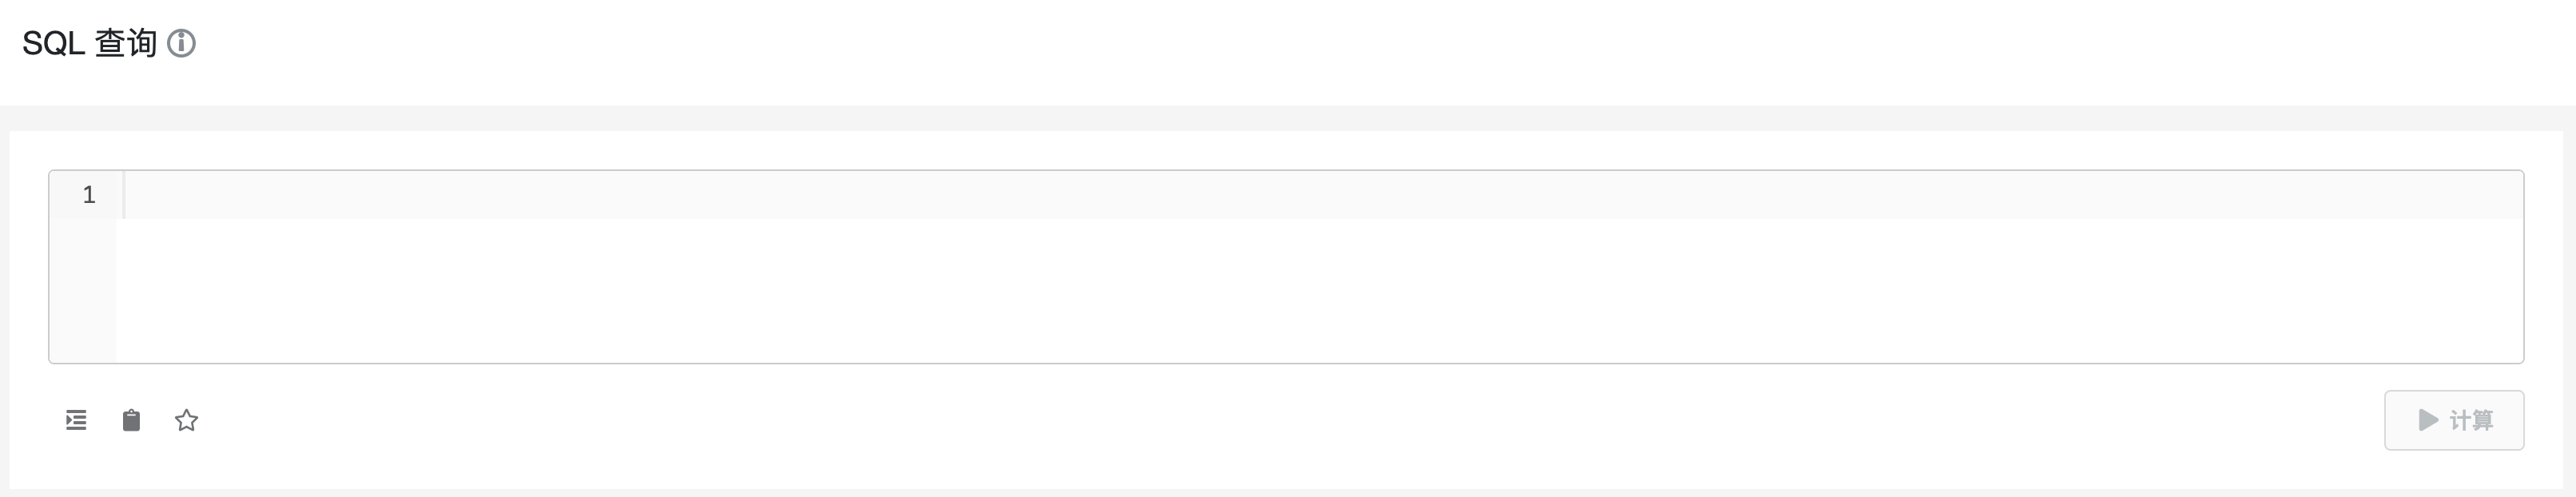
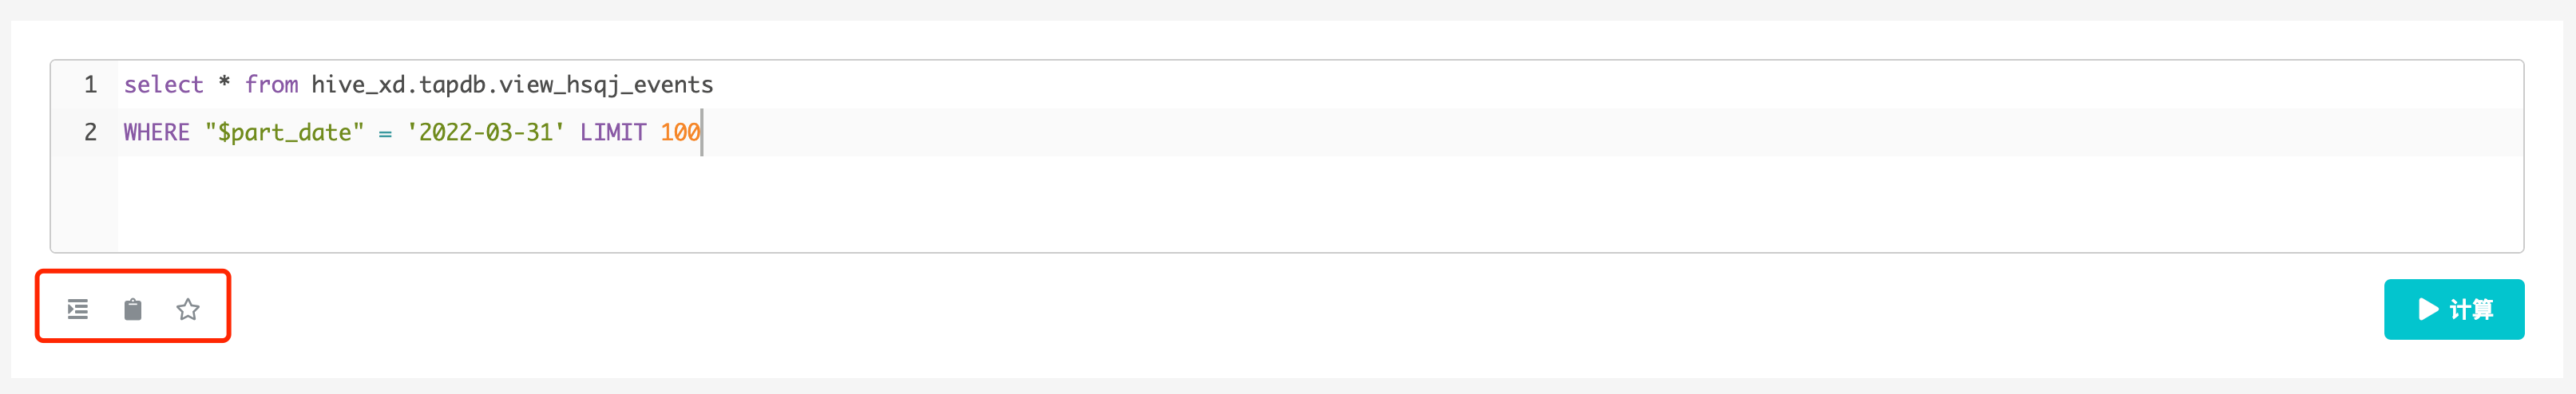
SQL 语句的编写与执行主要在语句编写框内进行。
4.1 基本语法
TapDB 采用 Presto 查询引擎,适用标准 SQL 语法,但仅可以使用 select 语句以及 with 子句,可以访问 presto 文档 获取 Presto 的语法以及函数的使用方法。
数据表中的字段名建议使用双引号 " " 括起,也可以缺省,但如果查询字段名带有特殊符号(如 $、# 等),则必须使用双引号,
字符串必须使用单引号 ' ' 括起。
4.2 分区与时区
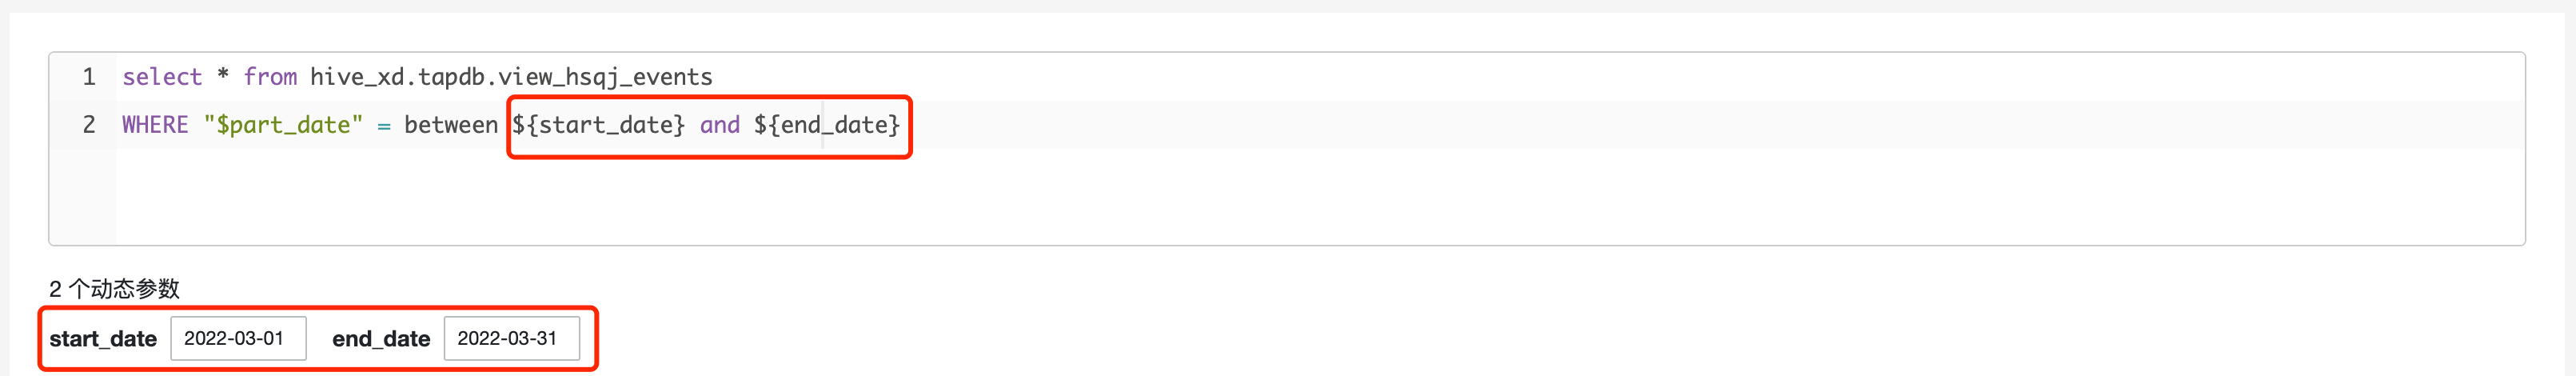
查询事件表时,必须使用分区键 $part_date 进行条件筛选,避免全表扫描。

建议使用以下类型的分区限制条件:
"$part_date" = '2021-11-01'
"$part_date" in ('2021-11-01', '2021-11-02, '2021-11-03')
"$part_date" between '2021-11-01' and '2021-11-11'
SQL 查询功能默认按照东 8 区对时间类型的字段进行转化展示,如事件表中的 time,设备表、账号表中的 activation_time、last_login_time、first_charge_time、last_charge_time。
若项目不处于东 8 区,则可使用时间函数对其进行转化:
format_datetime("time" at time zone 'America/Chicago', 'yyyy-MM-dd')
part_date、$part_date 为按照项目时区进行转化后的字符串格式的日期,若无精准查询时、分、秒的需求,建议使用分区键的筛选满足时间筛选需求。
4.3 动态参数
使用动态参数功能可对查询语句中的参数进行替换,后续查询时只需在参数输入框下方输入参数值即可满足新的查询需求。
动态参数的表达式规则为 ${参数名},参数名需以英文字母开头,可包括英文字母、数字和下划线,参数名相同的参数视为一个参数,可以创建多个参数变量,下方输入框按照各参数首次出现的顺序与动态参数对应,多个同一参数名的参数仅对应一个参数输入框。
4.4 工具栏操作
工具栏位于输入框下方,可执行以下操作:
格式化:将查询语句进行格式化
复制语句:将输入框内的查询语句复制到剪切板
添加书签:将查询语句保存为书签,方便后续进行查询或进行修改
4.5 快捷操作
光标位于输入框时,可执行以下快捷操作:
Ctrl + Enter:执行计算
Ctrl + Shift + F:格式化当前查询语句
Ctrl + Z:撤销上一步操作
Ctrl + Y:恢复上一步操作
4.6 执行查询
完成 SQL 语句编写后,可点击「计算」按钮,或者快捷键 Ctrl + Enter ,发起数据查询。
默认单次查询最多 10000 条数据,系统会为查询语句自动添加「limit 10000」,对查询行数进行限制,前端最多展示 500 行,可通过「查询历史」、「查询结果」中的下载功能查看所有数据。
5 标签页
标签页由「表结构」、「查询历史」、「语句书签」和「查询结果」构成。
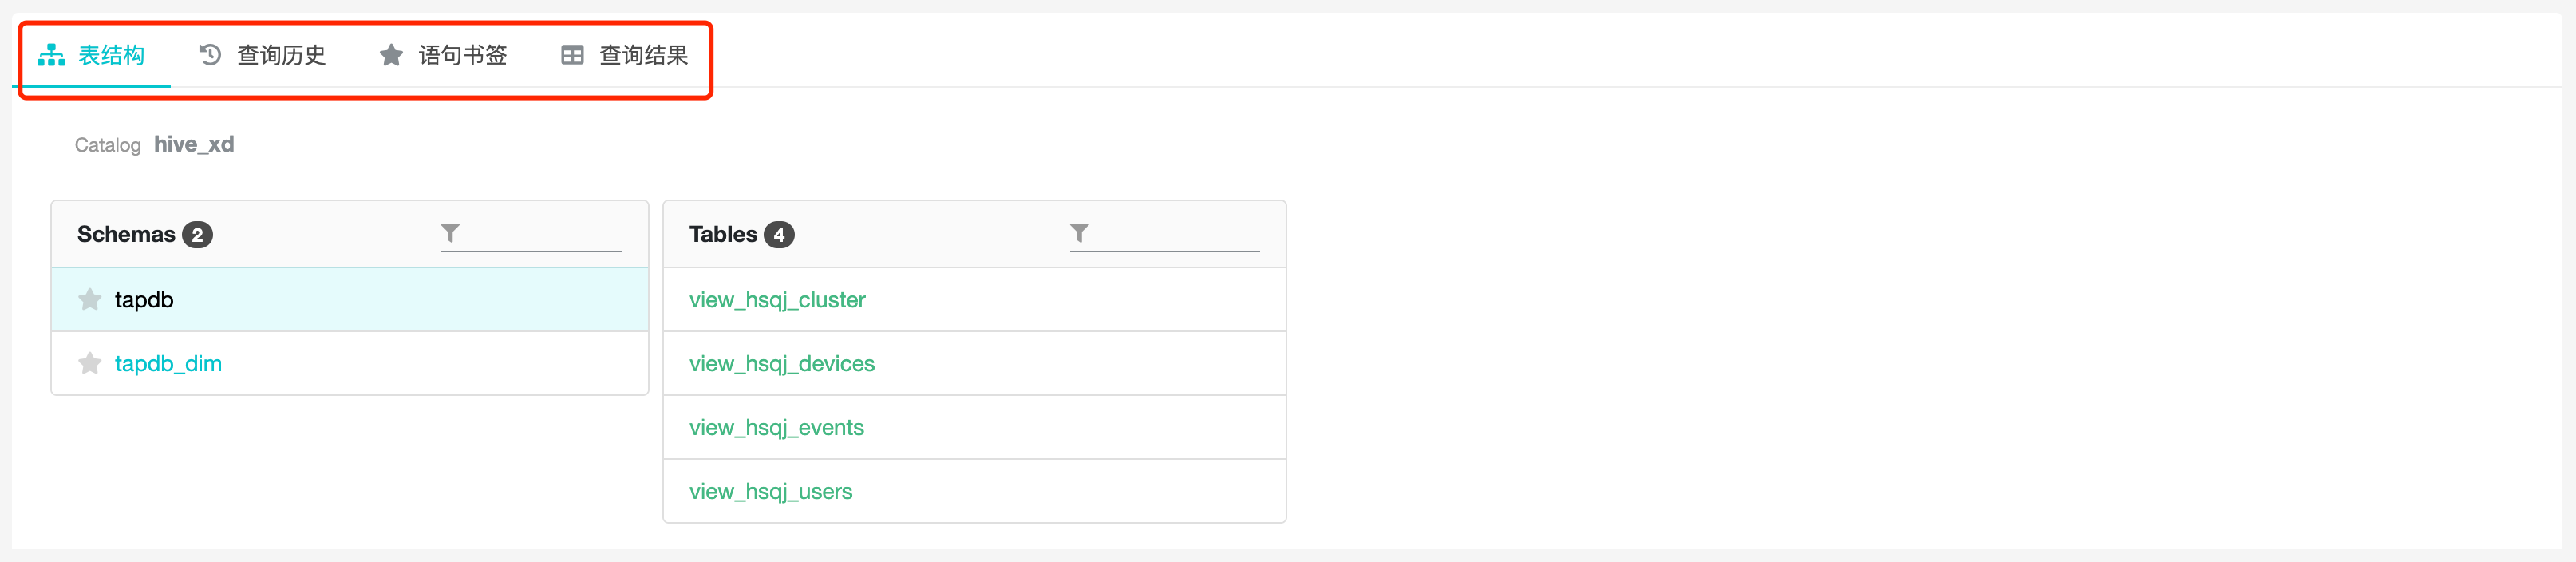
5.1 表结构
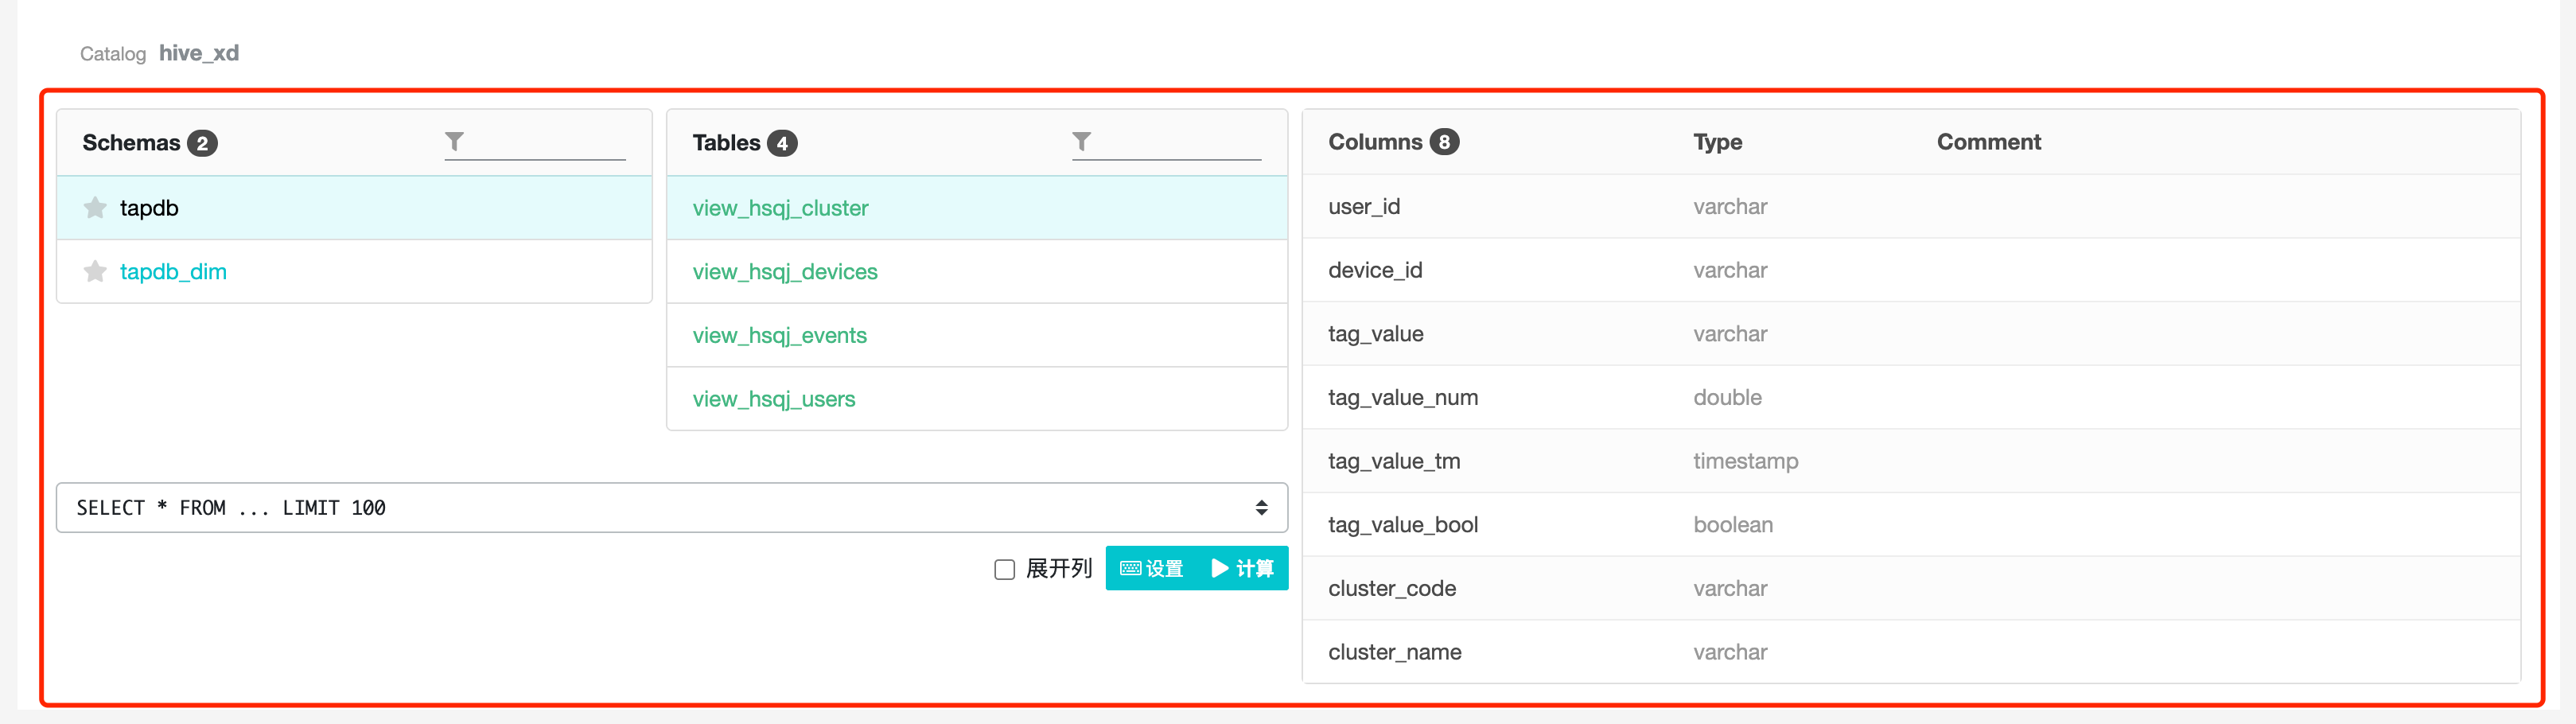
表结构页可查看数据库、数据表、表字段的详细信息,从左至右由数据库列表、数据表列表、表字段列表 3 部分构成。
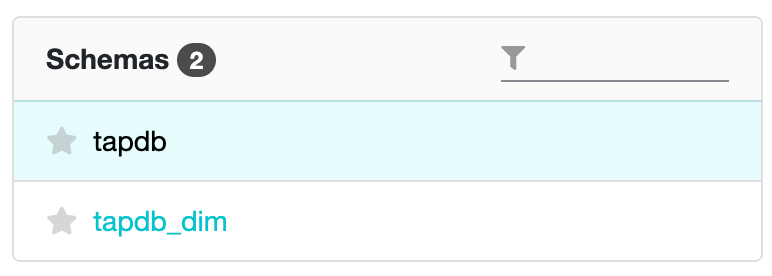
5.1.1 数据库列表
数据库列表中可查看项目下的数据库,点击列表中的库名,右侧将会展示该库下的数据表列表。
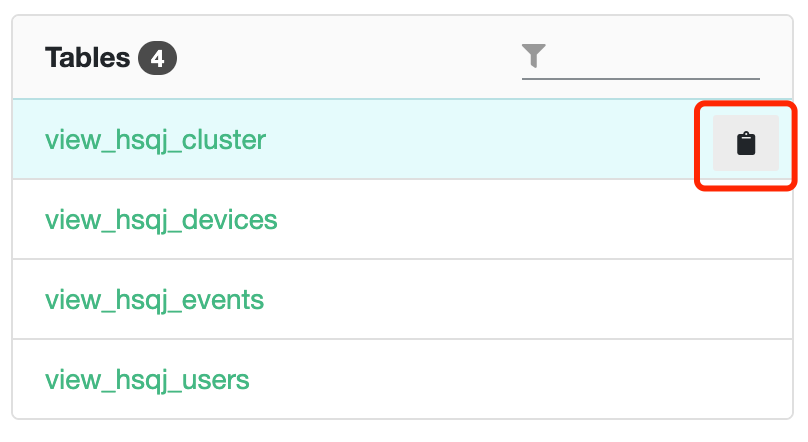
5.1.2 数据表列表
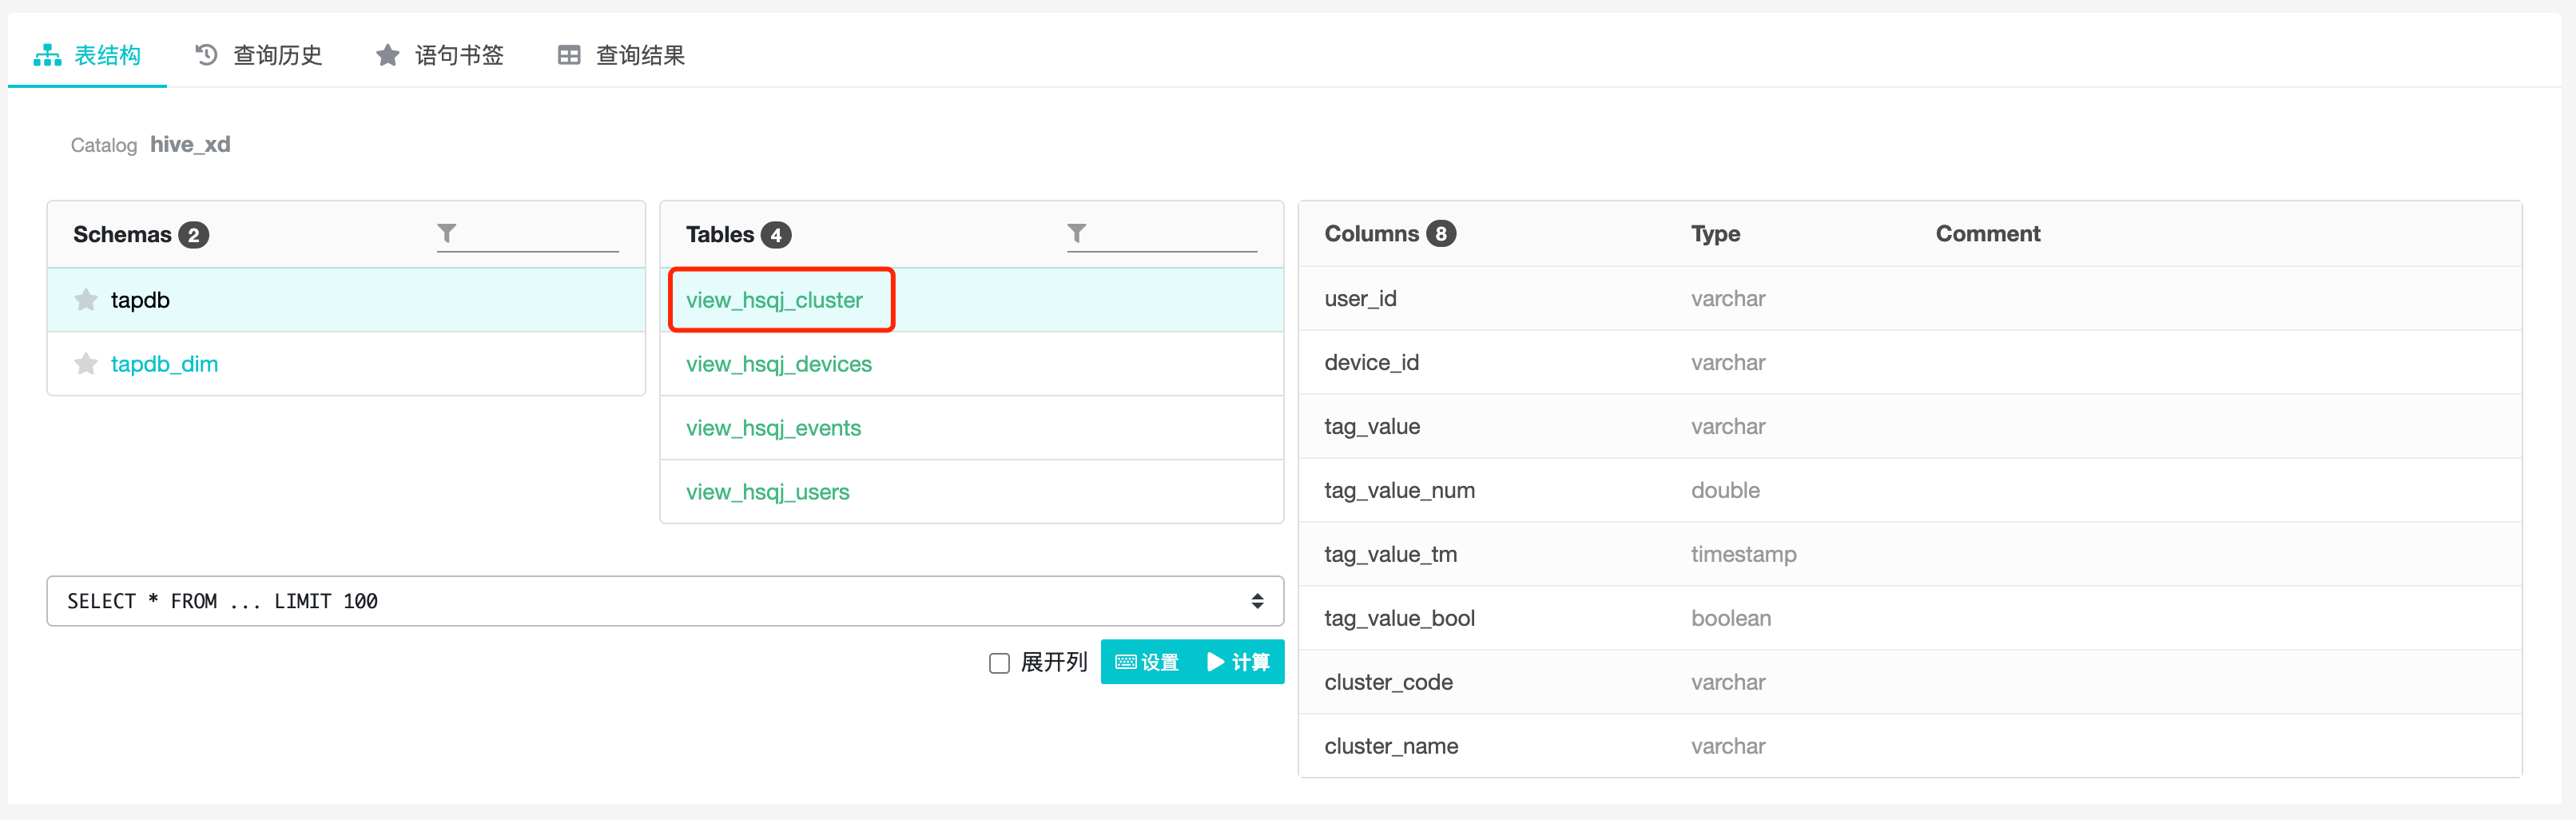
数据表列表中可查看选中的数据库下的数据表,点击列表中的表名,右侧将会展示该表下的字段列表。
点击「复制表名」按钮,将复制该表的表名至剪切板。
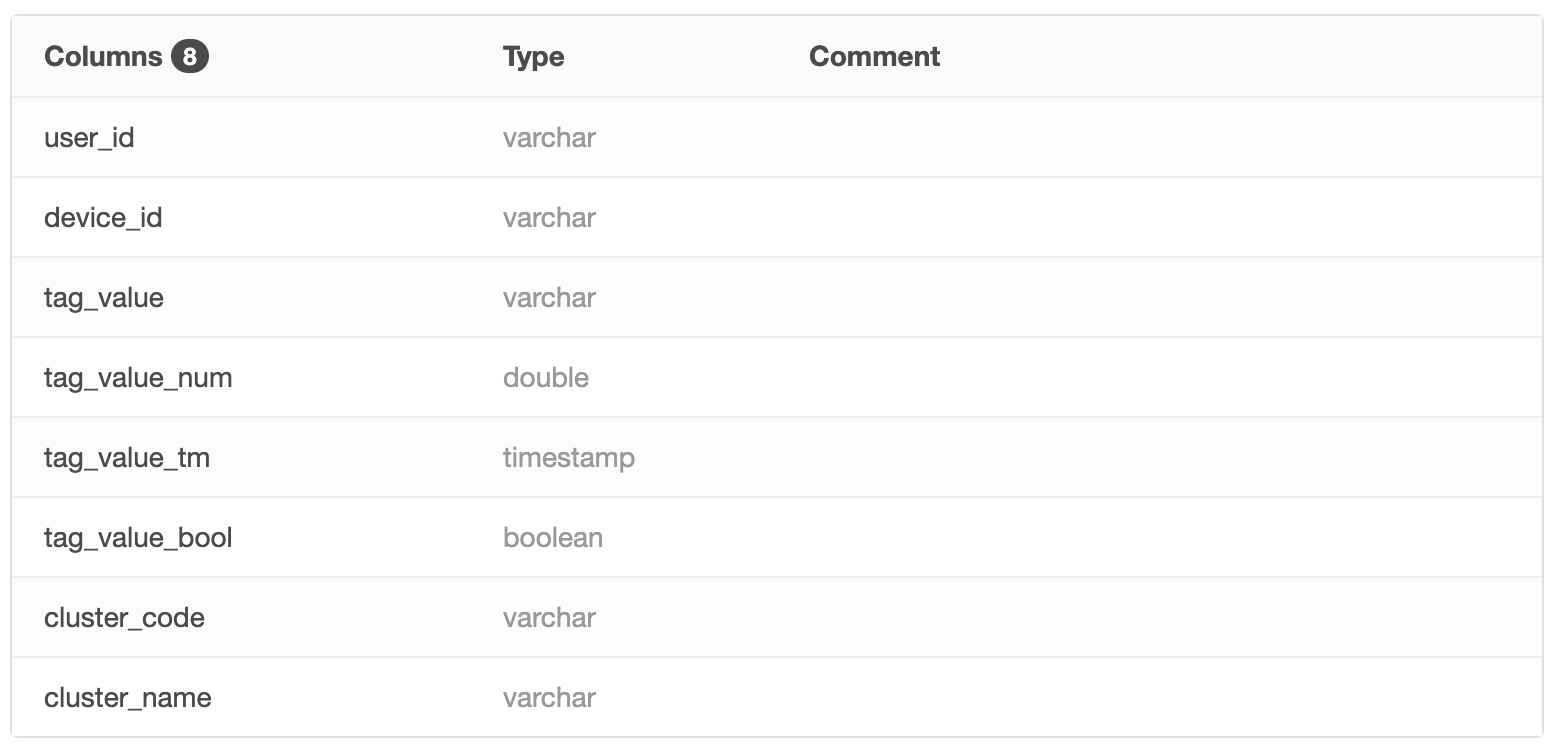
5.1.3 表字段列表
表字段列表中可查看选中表的所有字段的信息,包括字段名、数据类型、解释。
5.2 查询历史
查询历史页中可查看执行过的查询语句,包括语句的完成时间、计算耗费时间、查询语句等信息,并可对查询语句进行搜索,快速找到相应语句。
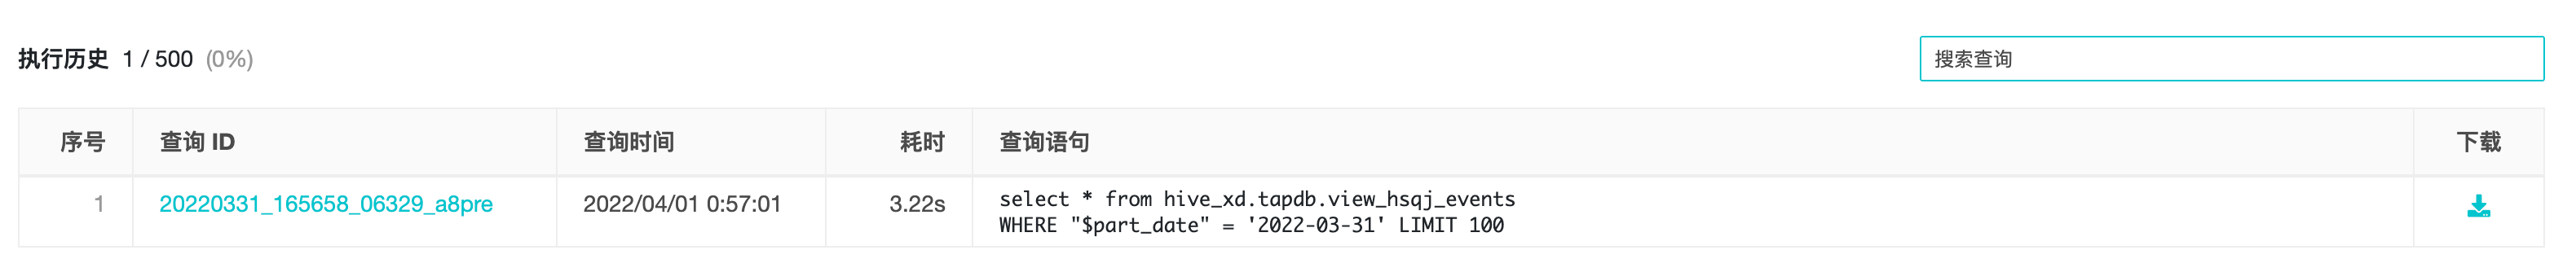
点击「查询 ID」,可跳转至相应查询结果;
点击「查询语句」右上角「键入」按钮,可将该语句将替换至输入框中;
点击「下载」,将该查询结果以 csv 格式文件的形式下载到本地,查询结果页面展示上限为 500 条,超过上限的数据可以使用下载功能下到本地后进行进一步查看与分析,数据下载上限为 10000 条。

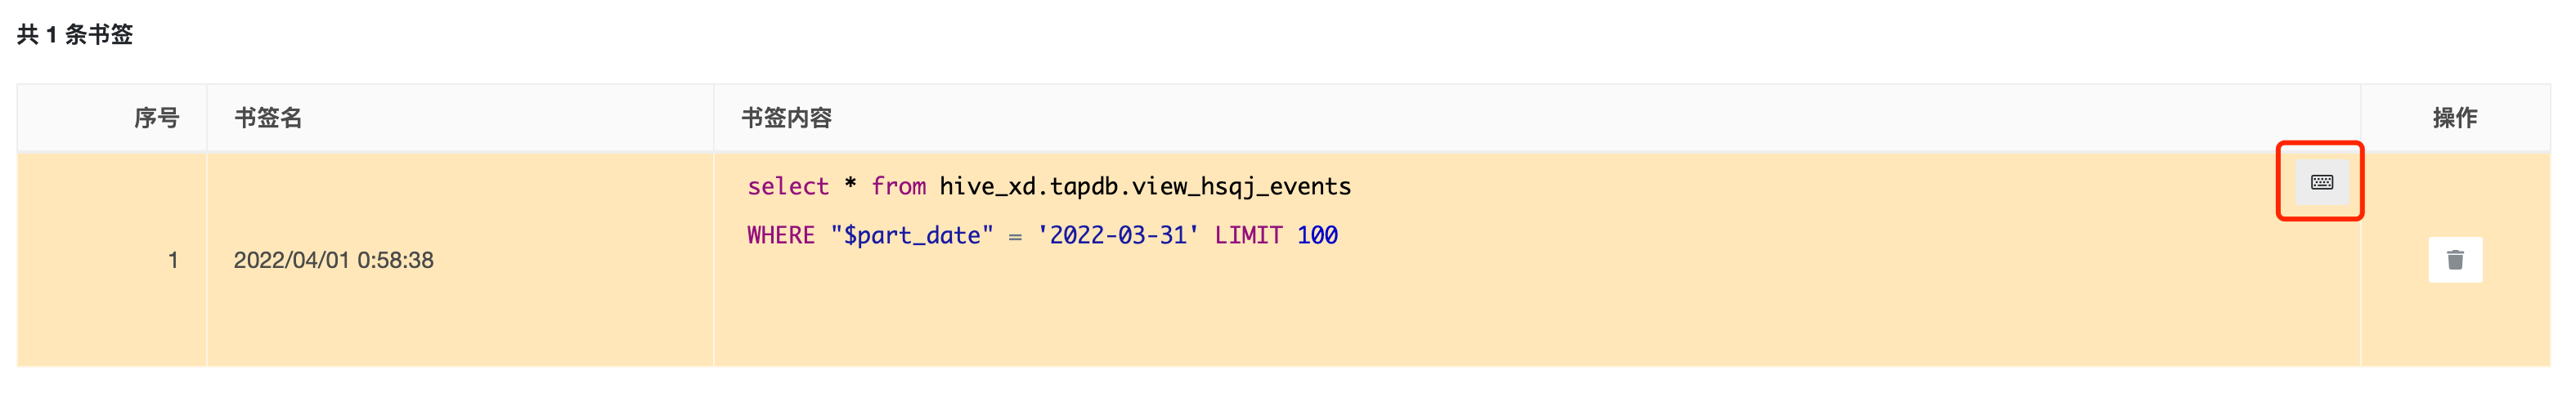
5.3 语句书签
语句书签页中可查看已保存的语句书签。
点击「设置」,书签中的内容将替换语句输入框中的内容,点击「删除」,可删除该书签。
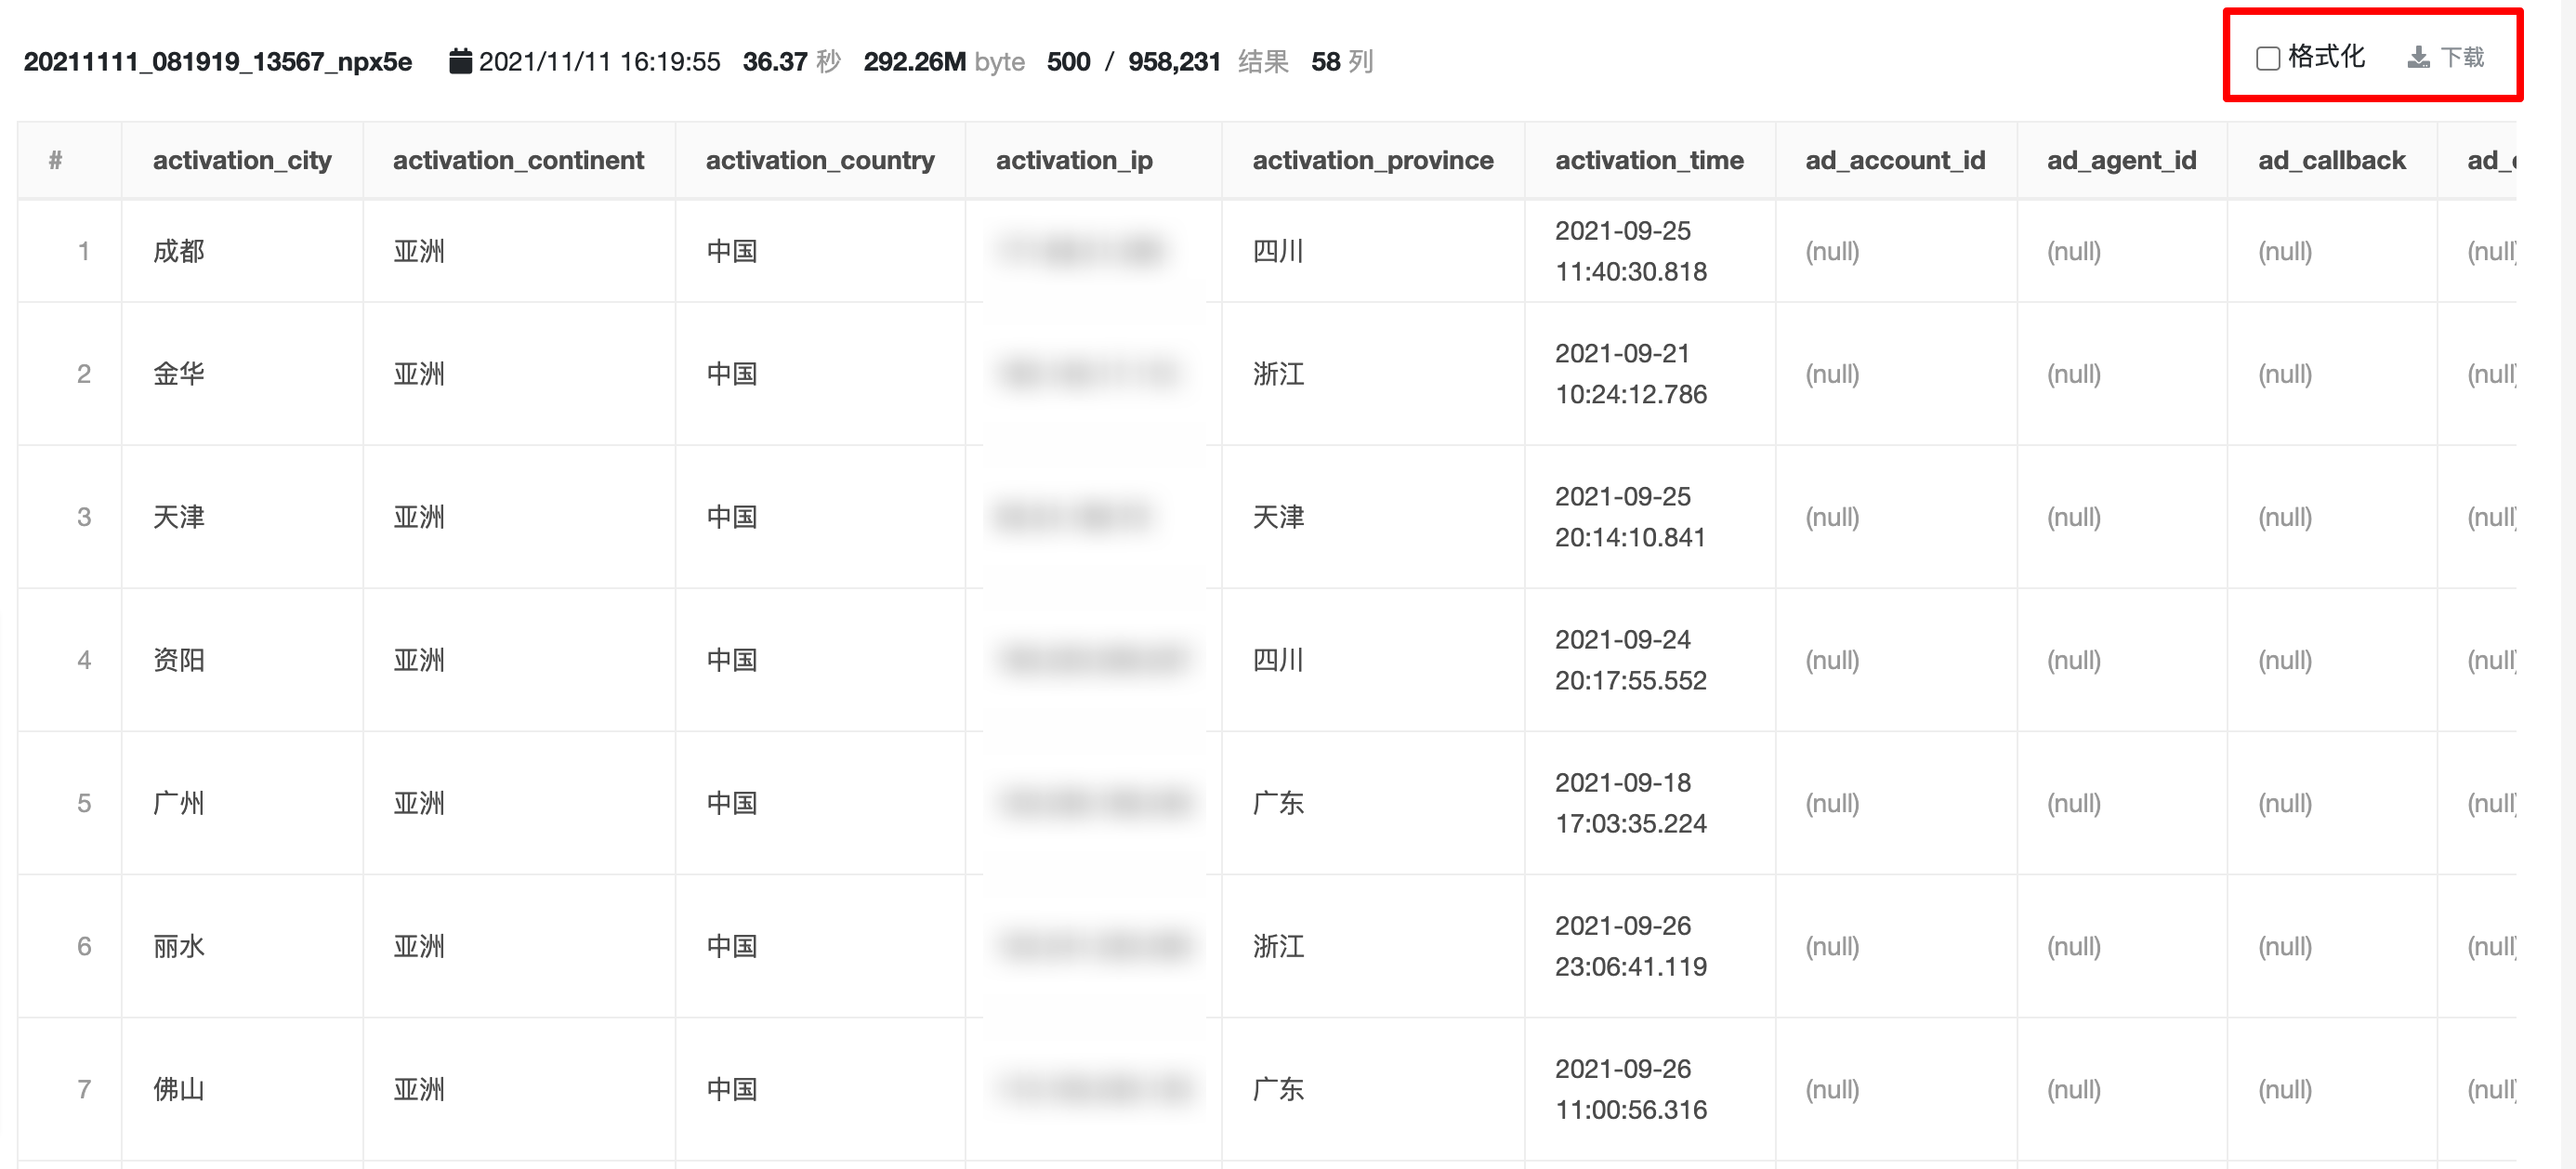
5.4 查询结果
查询结果页中可查看历史查询结果。
点击「格式化」,将查询结果中的 json、map 等类型的对象进行格式化展示;
点击「下载」,将该查询结果以 csv 格式文件的形式下载到本地,同「查询历史」中的「下载」功能。
6 最佳实践
6.1 日志导出
导出用户表或事件表,如导出近 7 日用户的所有事件日志:
select
    *
from hive.tapdb.view_{{项目 ID}}_events
where "$part_date" between '2021-11-05' and '2021-11-11'
6.2 数据清洗与提取
提取复杂字段,如:url、json、map 中的关键信息,如提取 url 中后 10 位数字的商品 ID:
select
    substring("#url", -10) as product_id
from hive.tapdb.view_{{项目 ID}}_events
where "$part_date" between '2021-11-05' and '2021-11-11'
6.3 个性化取数与分析
各种 TapDB 现有分析模型无法满足的个性化分析需求。