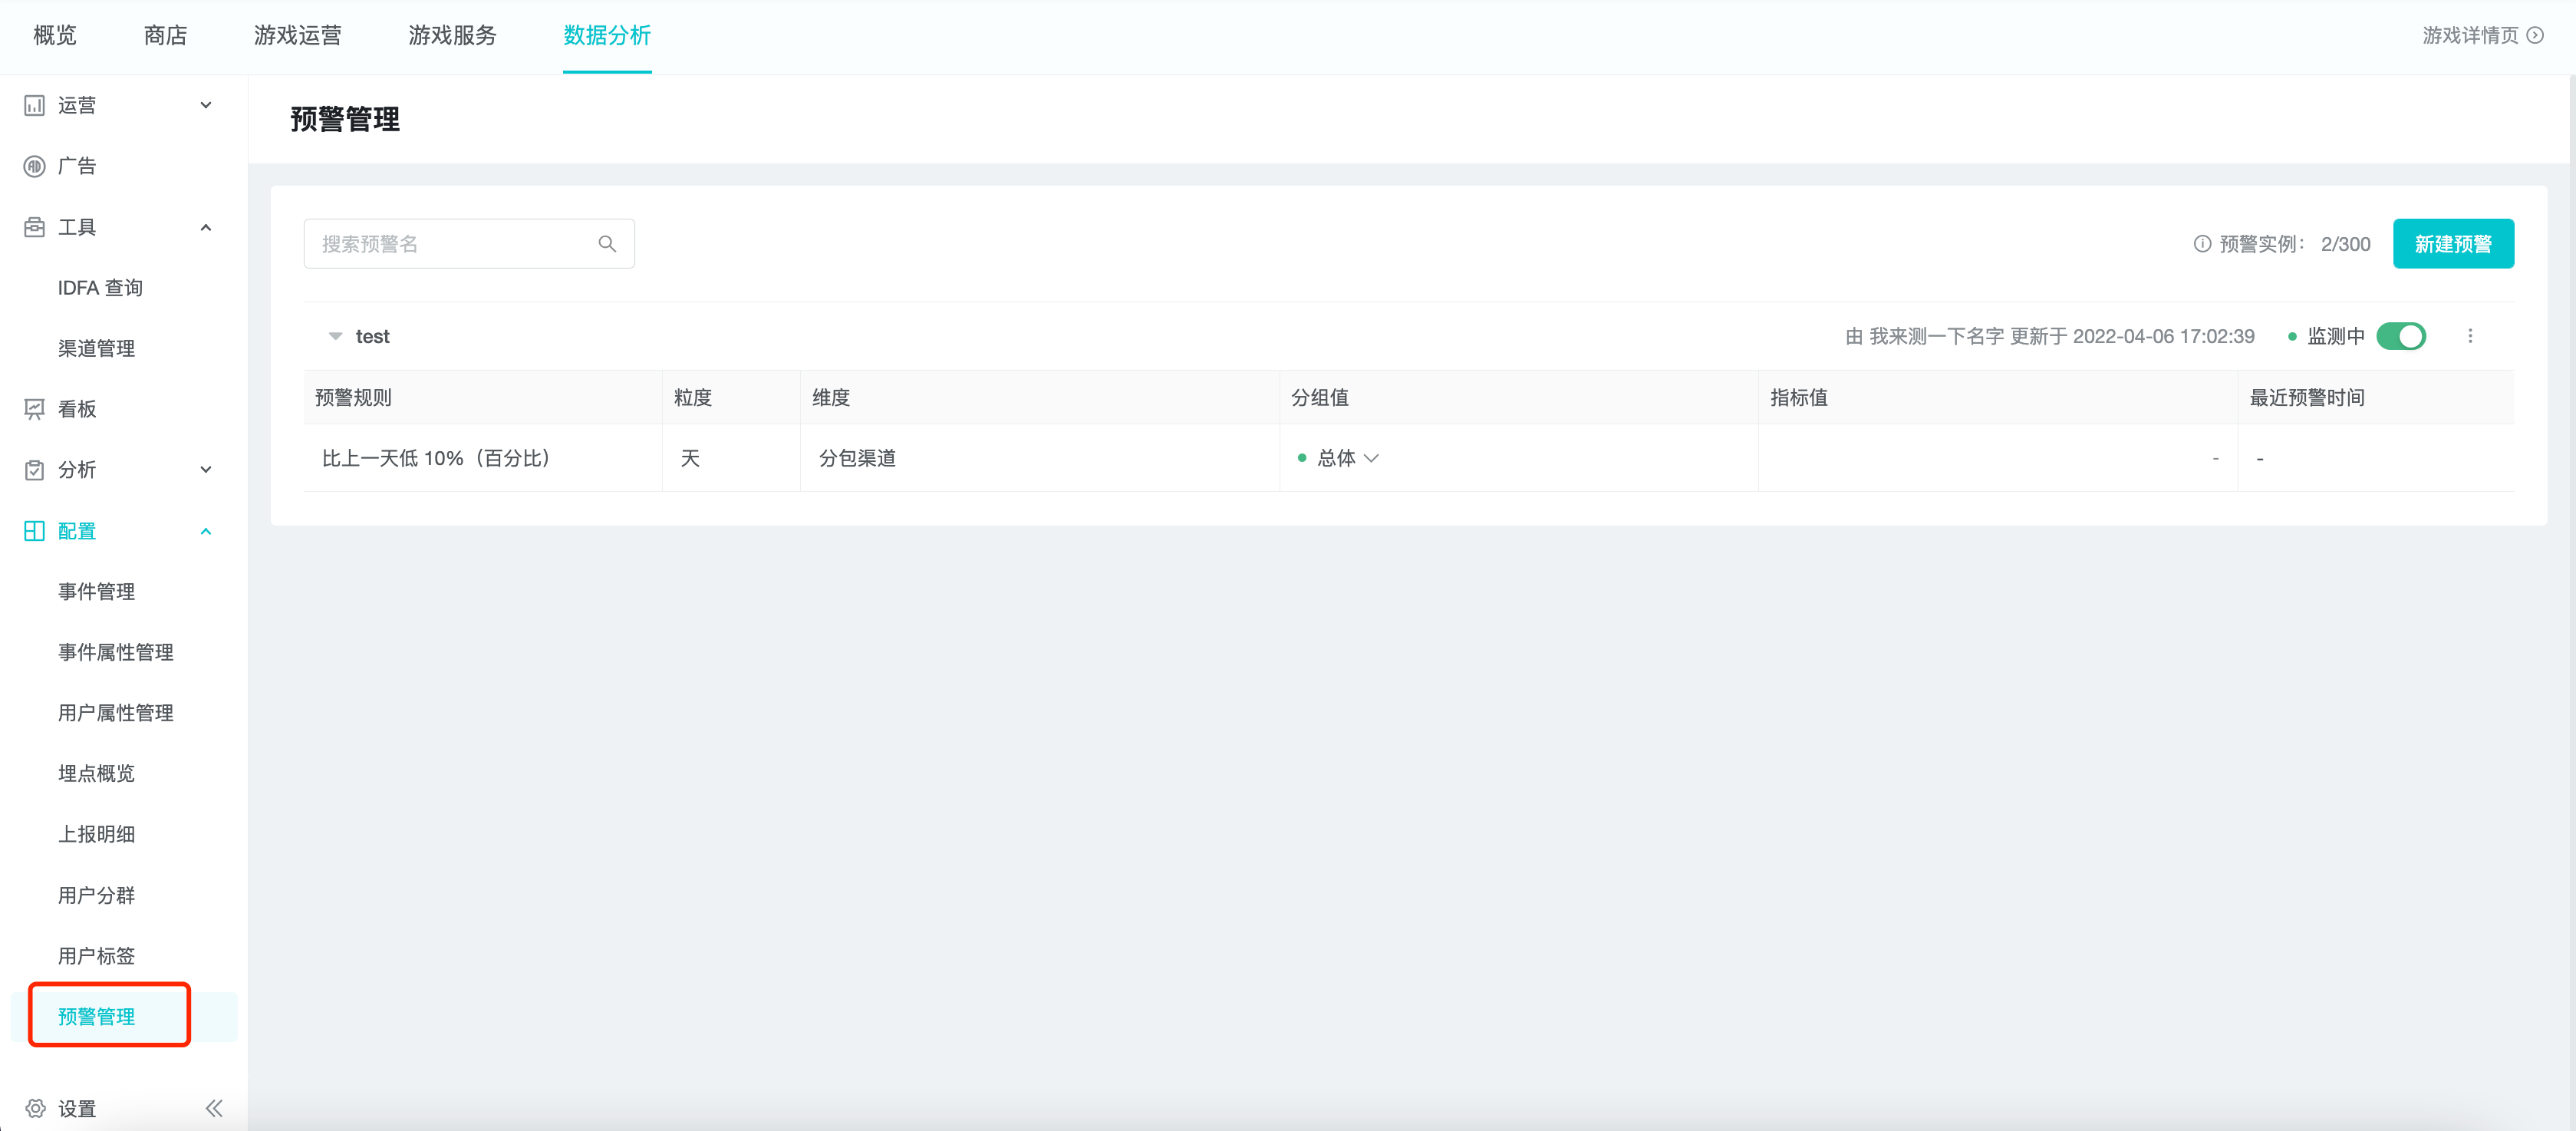
预警管理
1. 概述
通过设置指标和筛选分组项,构建一组时间序列数据。按照时间颗粒度定时查询并与历史数据进行比较,触发预警规则后通知项目组成员。
目前支持以「事件分析」的形式设置指标,以邮件方式进行预警通知。
2. 适用角色��与用途
| 角色 | 用途 |
|---|---|
| 分析师 / 业务人员 | 对重点或异常数据进行预警监控,实时掌握产品动态,并可在第一时间发现异常问题 |
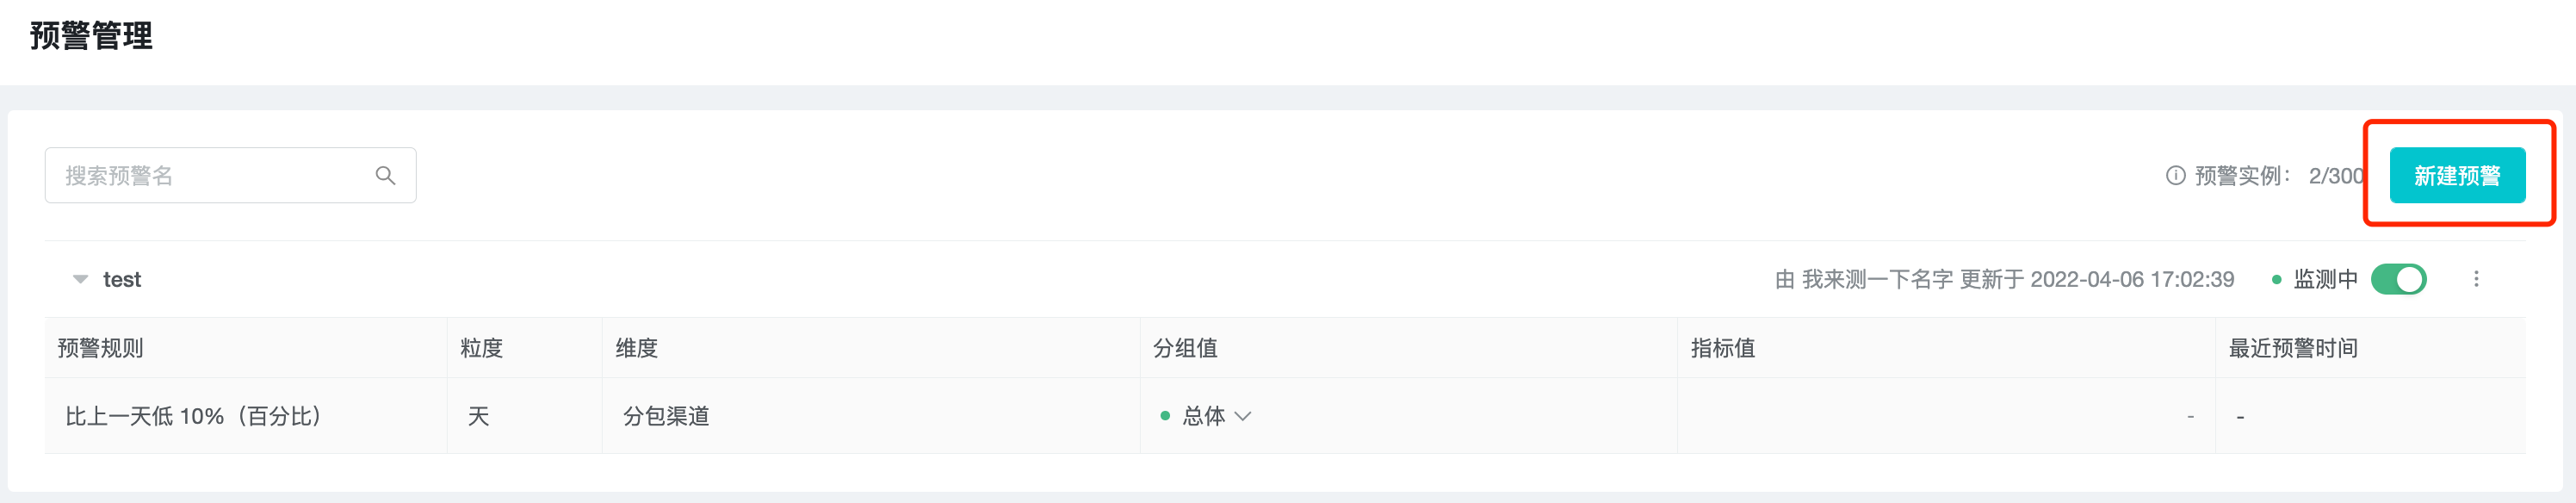
3. 新建数据预警
点击预警列表右上角的新建预警。
3.1 基础信息
在「基础信息」部分依次录入或选择预警名、查询主体与预警指标。
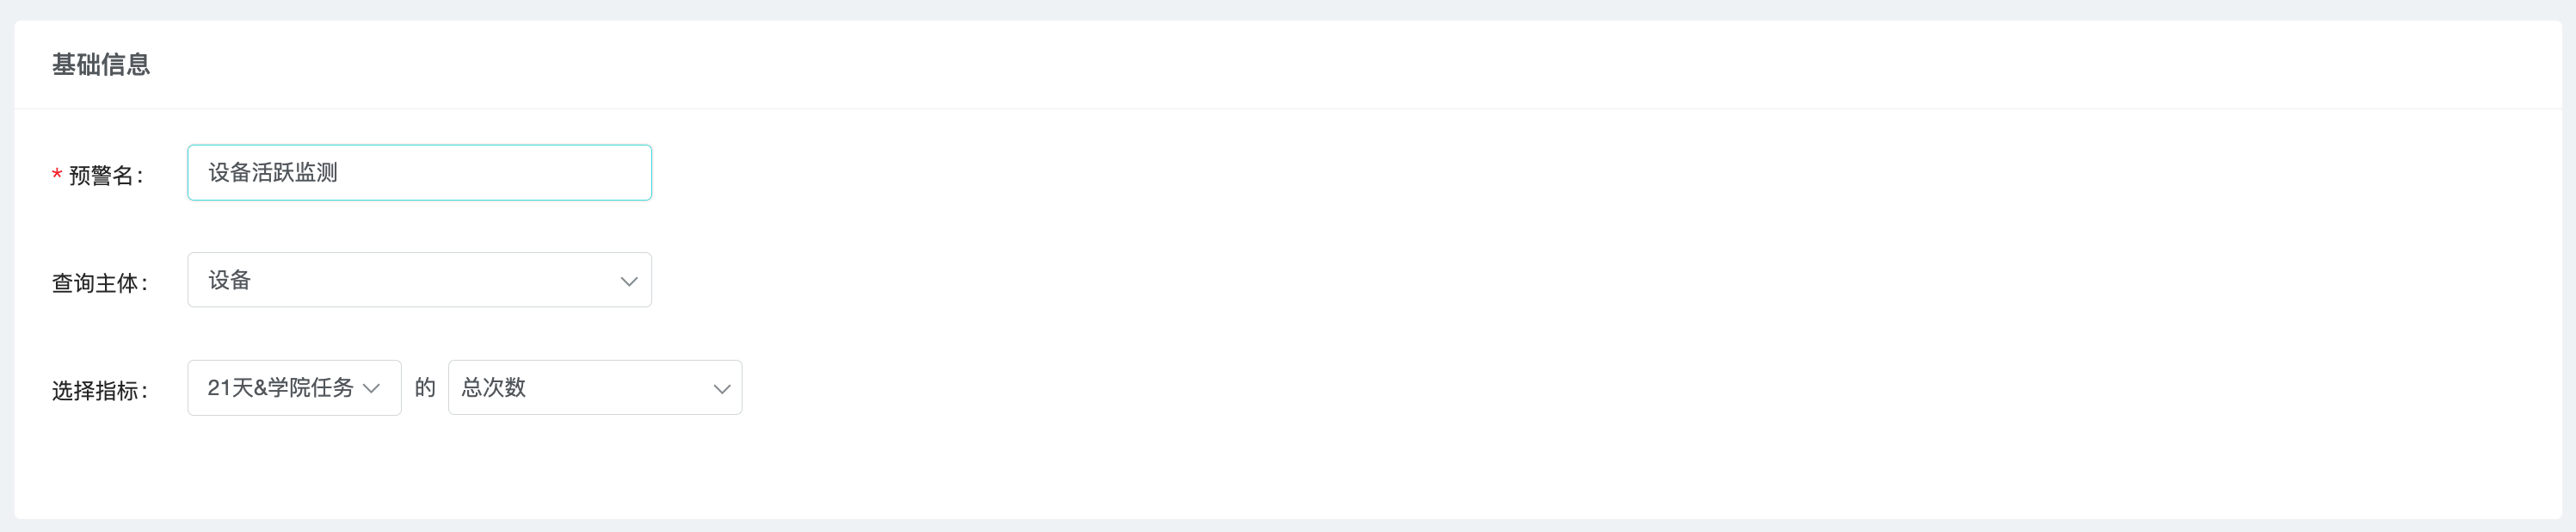
预警名展示在预警列表中,是识别一个预警的依据。
查询主体可选择「账号」或「设备」,与「事件分析」中查询主体类似。
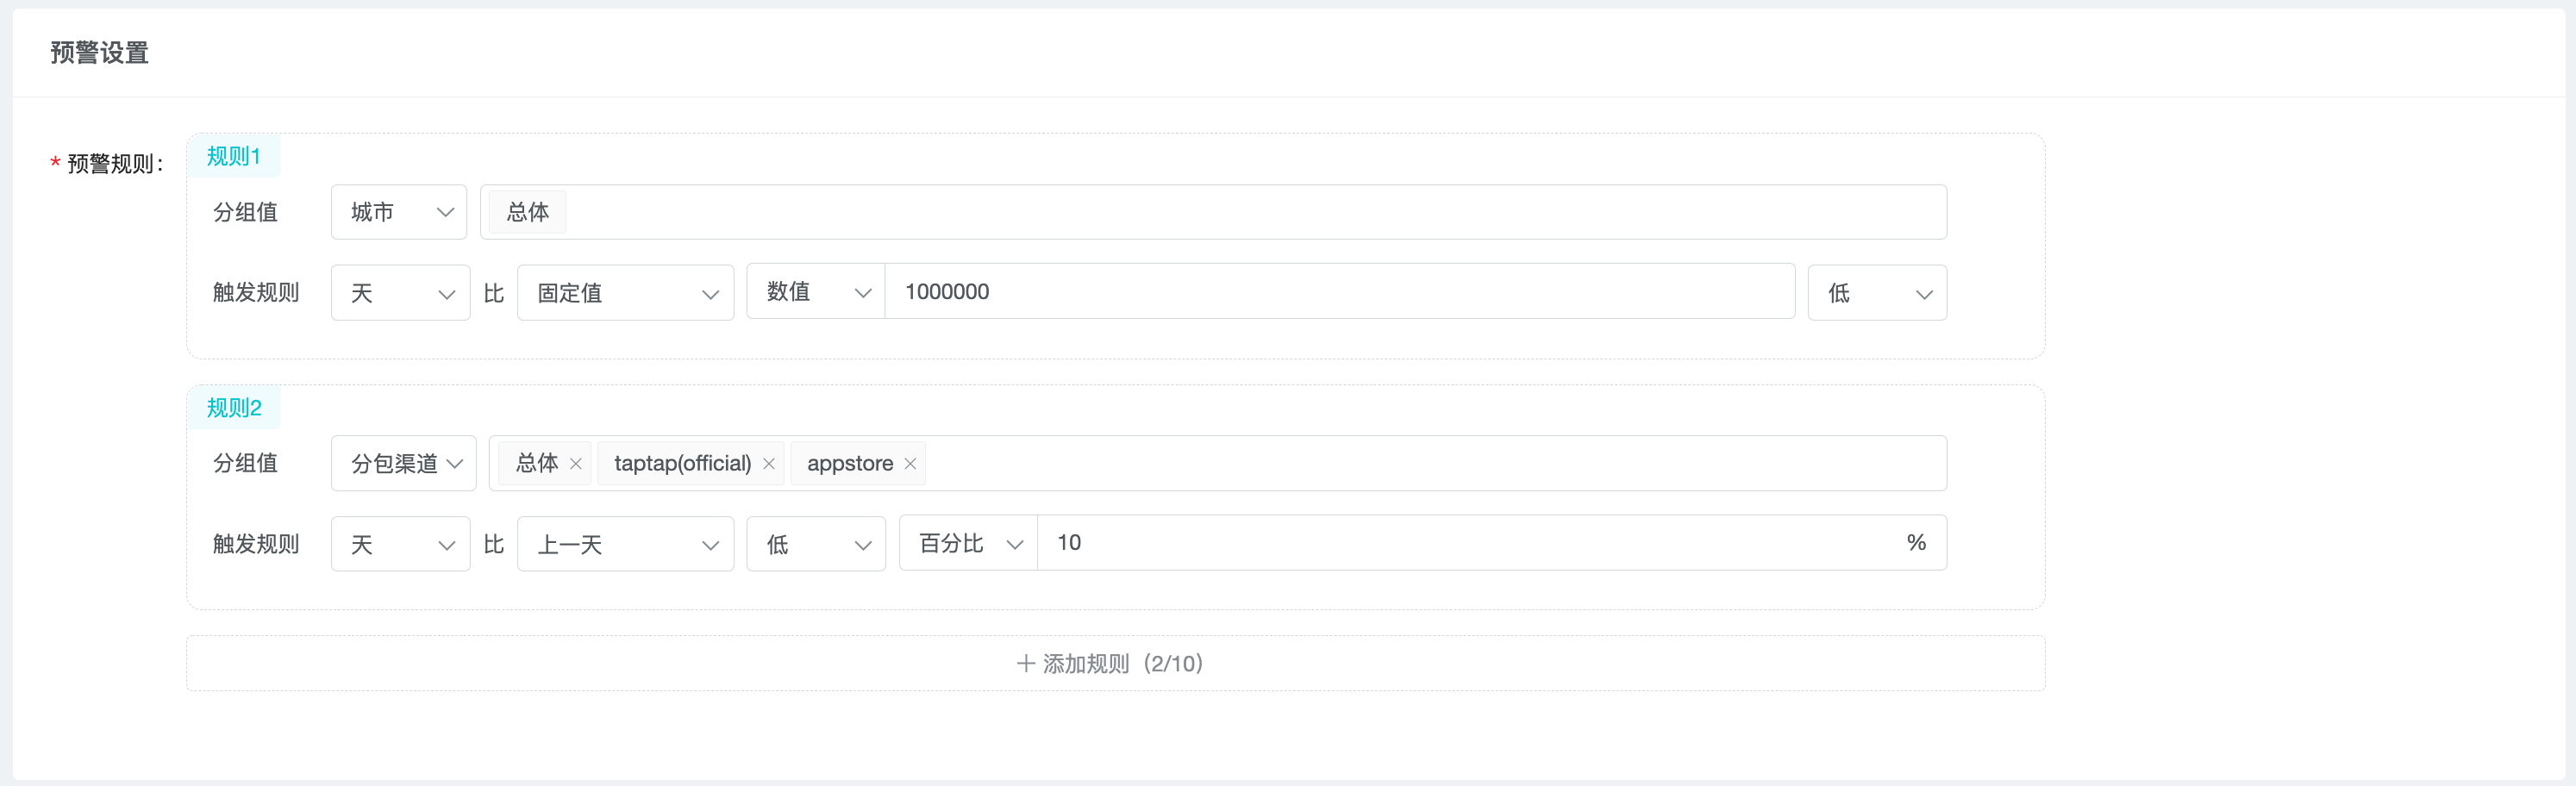
3.2 预警规则
3.2.1 添加预警规则
在预警规则中,可选择分组维度,并通�过多选分组值同时构造多组时间序列数据,当无分组维度时,默认分组项为「总体」。
可选预警时间粒度、比较基准与参数类型的关系如下表:
| 时间粒度 | 比较基准 | 参数类型 |
| 天 | 固定值 | 数值 |
| 上一天、上周同一天 | 数值、百分比 | |
| 过去7天均值、过去30天均值 | 数值、百分比、标准差 | |
| 小时 | 固定值 | 数值 |
| 上一小时、昨天同一小时 | 数值、百分比 | |
| 过去24时均值 | 数值、百分比、标准差 |
每个预警下可同时设置多条预警规则,每个预警规则下可添加多个分组。
3.2.2 预警规则详情
数值
固定值作为比较基准时:
高:指标实际值 > 数值
低:指标实际值 < 数值
非固定值作为比较基准时:
高:指标实际值 > 比较基准 + 数值
低:指标实际值 < 比较基准 - 数值
百分比
高:指标实际值 > 比较基准 * (1 + 百分比)
低:指标实际值 < 比较基准 * (1 - 百分比)
标准差
高:指标实际值 > 比较基准 + 参数 * 标准差
低:指标实际值 < 比较基准 - 参数 * 标准差
其中,标准差为比较基准均值对应的数量与时间颗粒度周期内的所有指标实际值的标准,如「过去 7 天均值」对��应的标准差为,过去 7 天每天的指标实际值的标准差。
3.3 通知设置

4. 预警通知
根据每条预警规则设置的时间颗粒度,系统会在每天或每小时结束后对预警指标按照设置的分组进行查询。
触发预警规则后将对通知设置中的渠道进行告警,如图:


5. 预警的管理与详情
5.1 预警列表管理
已创建的数据预警会以列表的形式展示在数据预警页,可对预警进行详情查看、启动 / 暂停、编辑、复制、删除等操作。
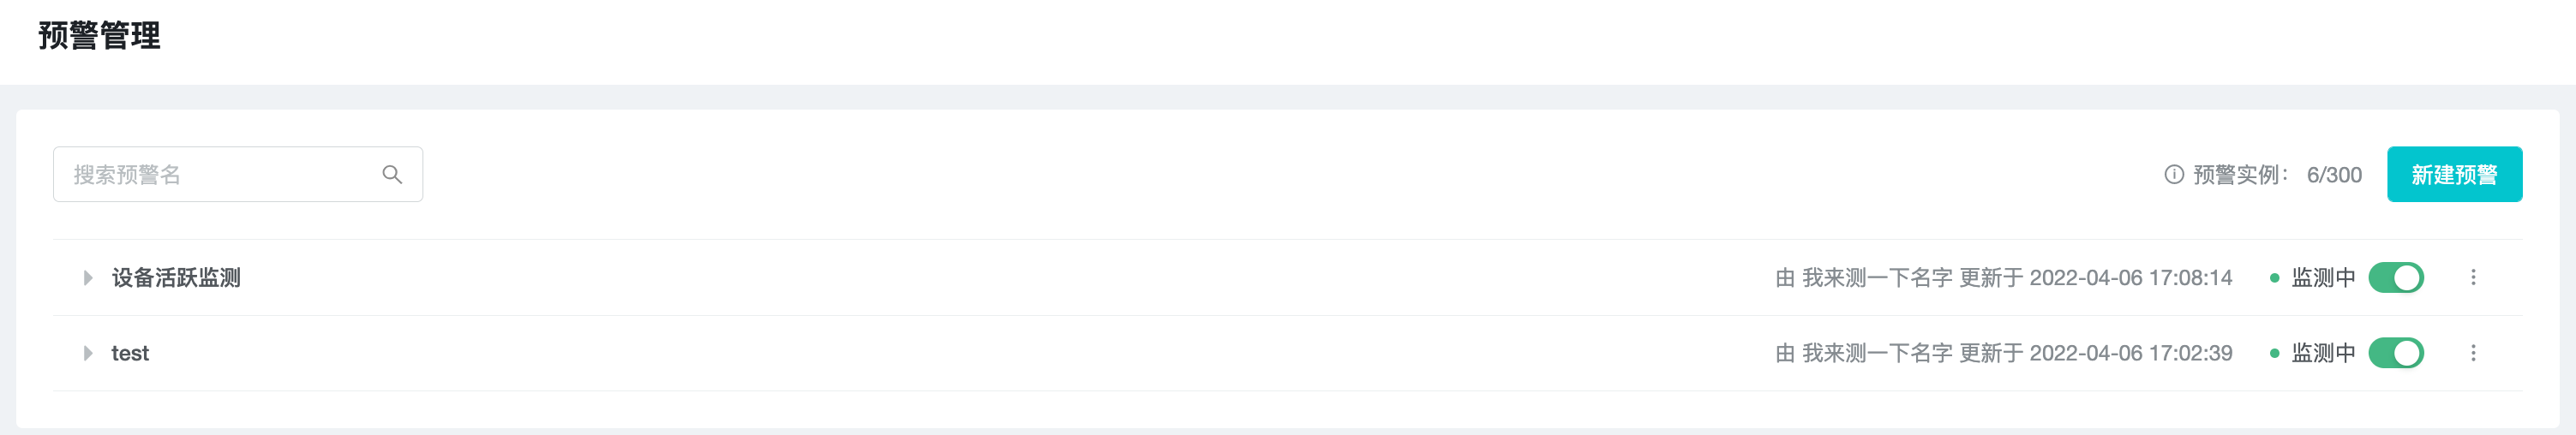
数据预警的使用进度以「预警实例」作为最基本的单位,预警规则下的一个分组为一个「预警实例」,上限为 30,可通过删除预警、预警规则或勾除分组释放使用进度。
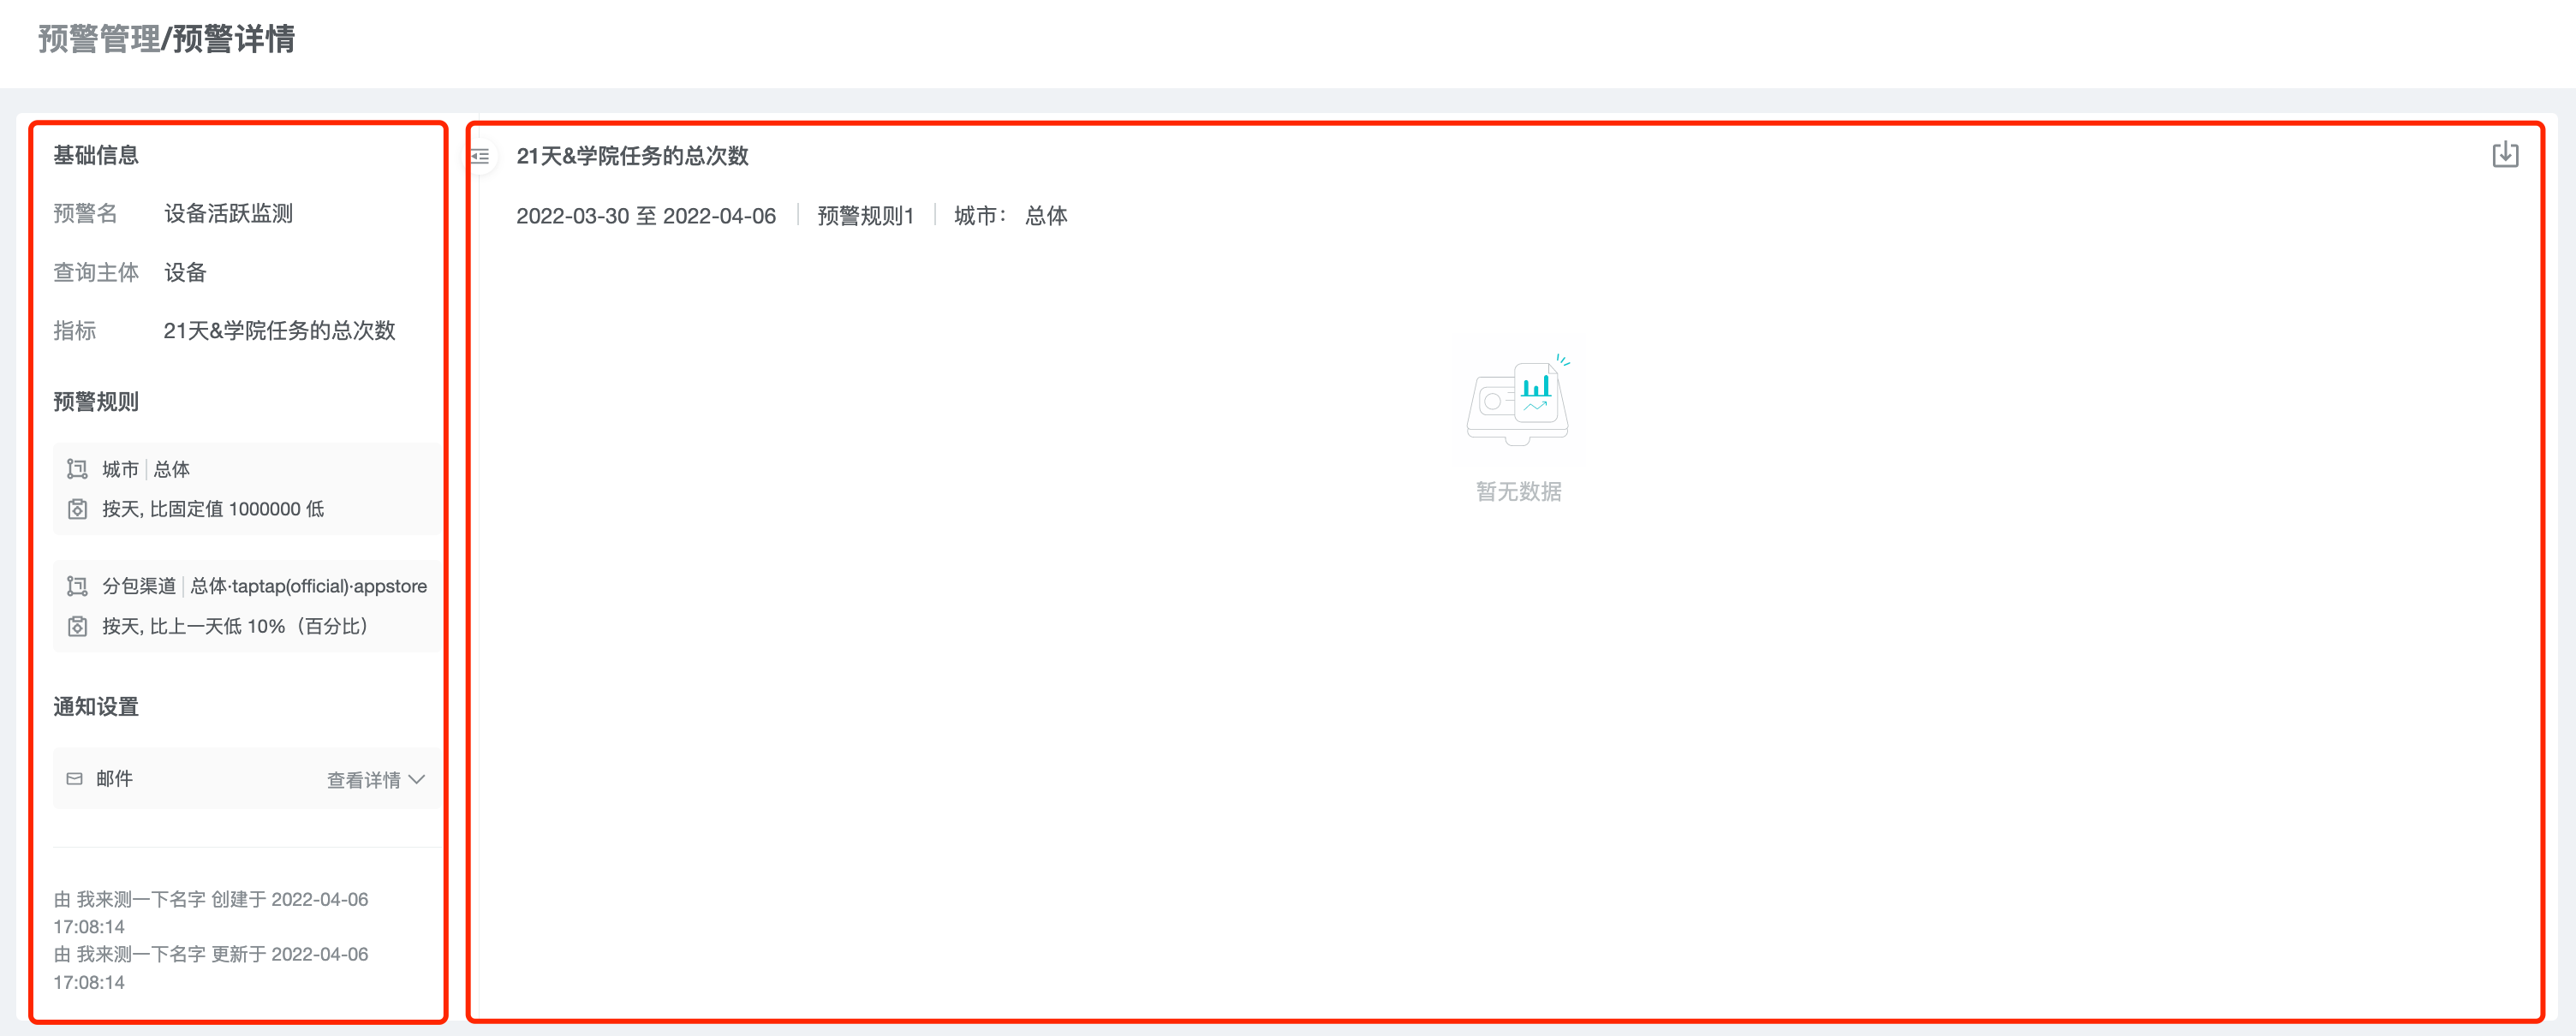
5.2 预警详情
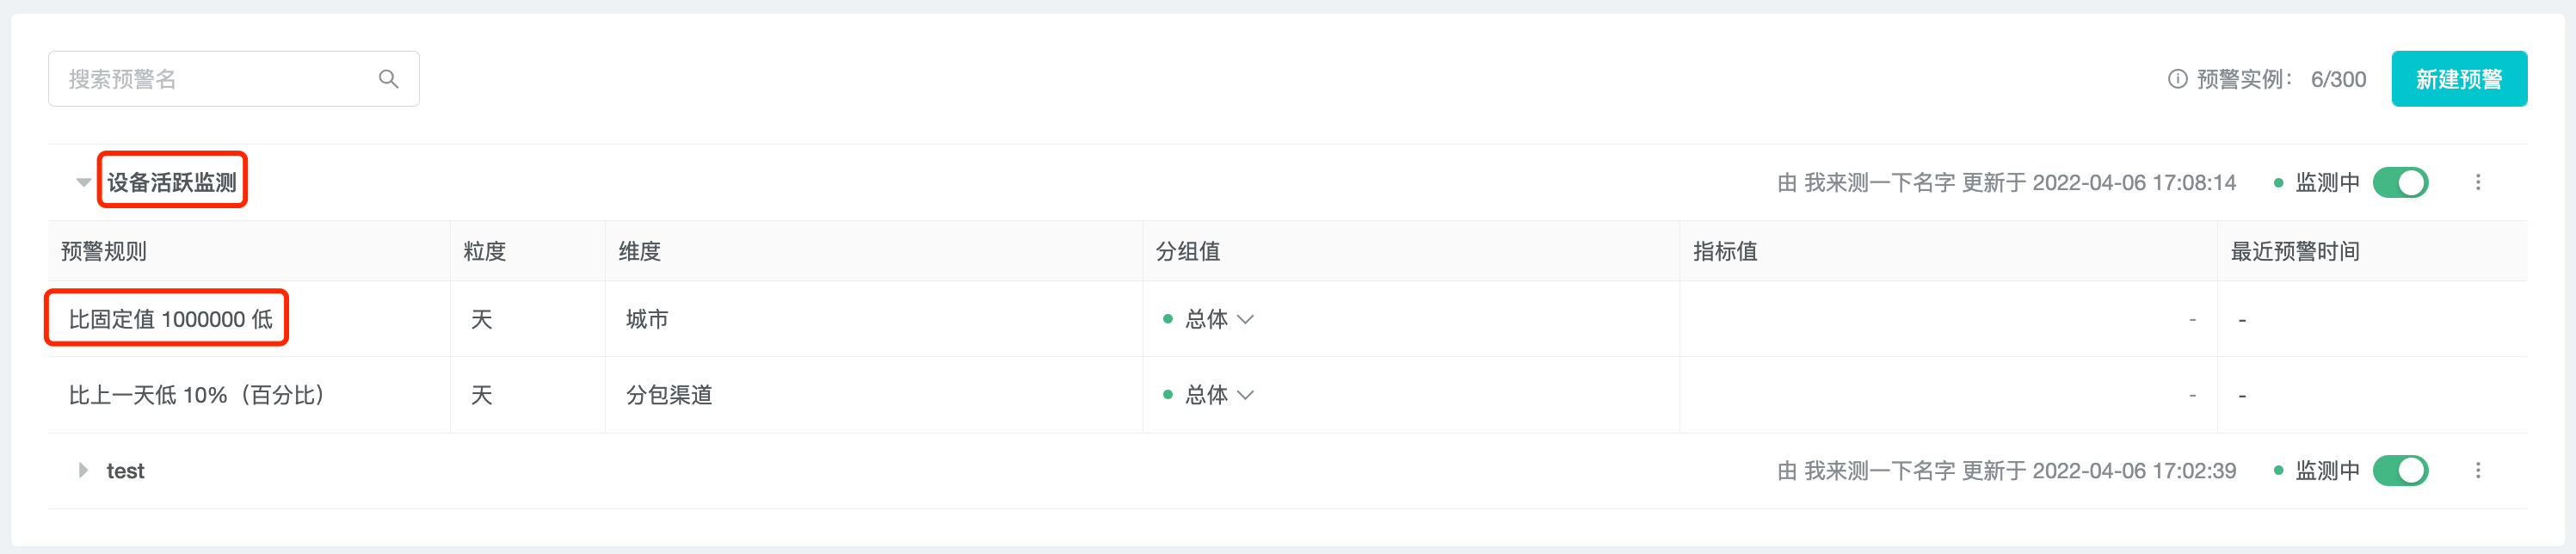
点击预警列表中的预警名跳转至该预警的详情页,点击预警规则跳转至该预警详情页,并筛选相应的预警规则。
页面左侧可看到该预警的「基础信息」、「预警规则」与「通知设置」。
页面右侧可看到当前筛选的预警规则与分组数据的历史趋势图与数据表,有预警发生的时刻以红点形式标记在趋势图中,可点击下载按钮下载数据表。
6. 最佳实践
6.1 通过「固定值」预警监控业绩指标
对于数值确定的业绩目标,如:充值金额、活跃用户数,可通过「固定值」预警监控其是否完成业绩目标。
6.2 通过「百分比」预警监控指标环比、同比变化
对于日常运营指标,如:活跃用户数、新增用户数,可通过「百分比」预警密切关注其变化趋势,一旦出现异常变化趋势,便于及时关注并干预。
6.3 通过「标准差」预警监控具有长期变化趋势的指标的短期异常变化
对于具有长期增长或衰减的指标,「标准差」预警可消除长期变化趋势对于短期变化的影响,从而监控该指标的短期异常变化情况。
6.4 多规则预警监控预警区间
对于某些重要指标,如:活跃用户数,可创建多条预警规则,同时监控是否完成业绩目标、变化趋势情况等,同时可以对同类监控规则创建「高」、「低」2 条规则,对指标的变化区间进行监控。
6.5 多分组预警探查异常数据维度
对于某些发生了异常变化的指标,可通过拆分分组,找到引起变化的主要维度,便于进一步进行下钻分析。