分布分析
一、引入案例
玩家付费是一个非常重要的游戏内行为,我们希望了解最近一周玩家在游戏内的付费总金额分布情况,例如:0-100 元,101-200 元,201-300 元 ..., 的用户数量分别是多少。这时候,我们可以用「分布分析」的功能来呈现。
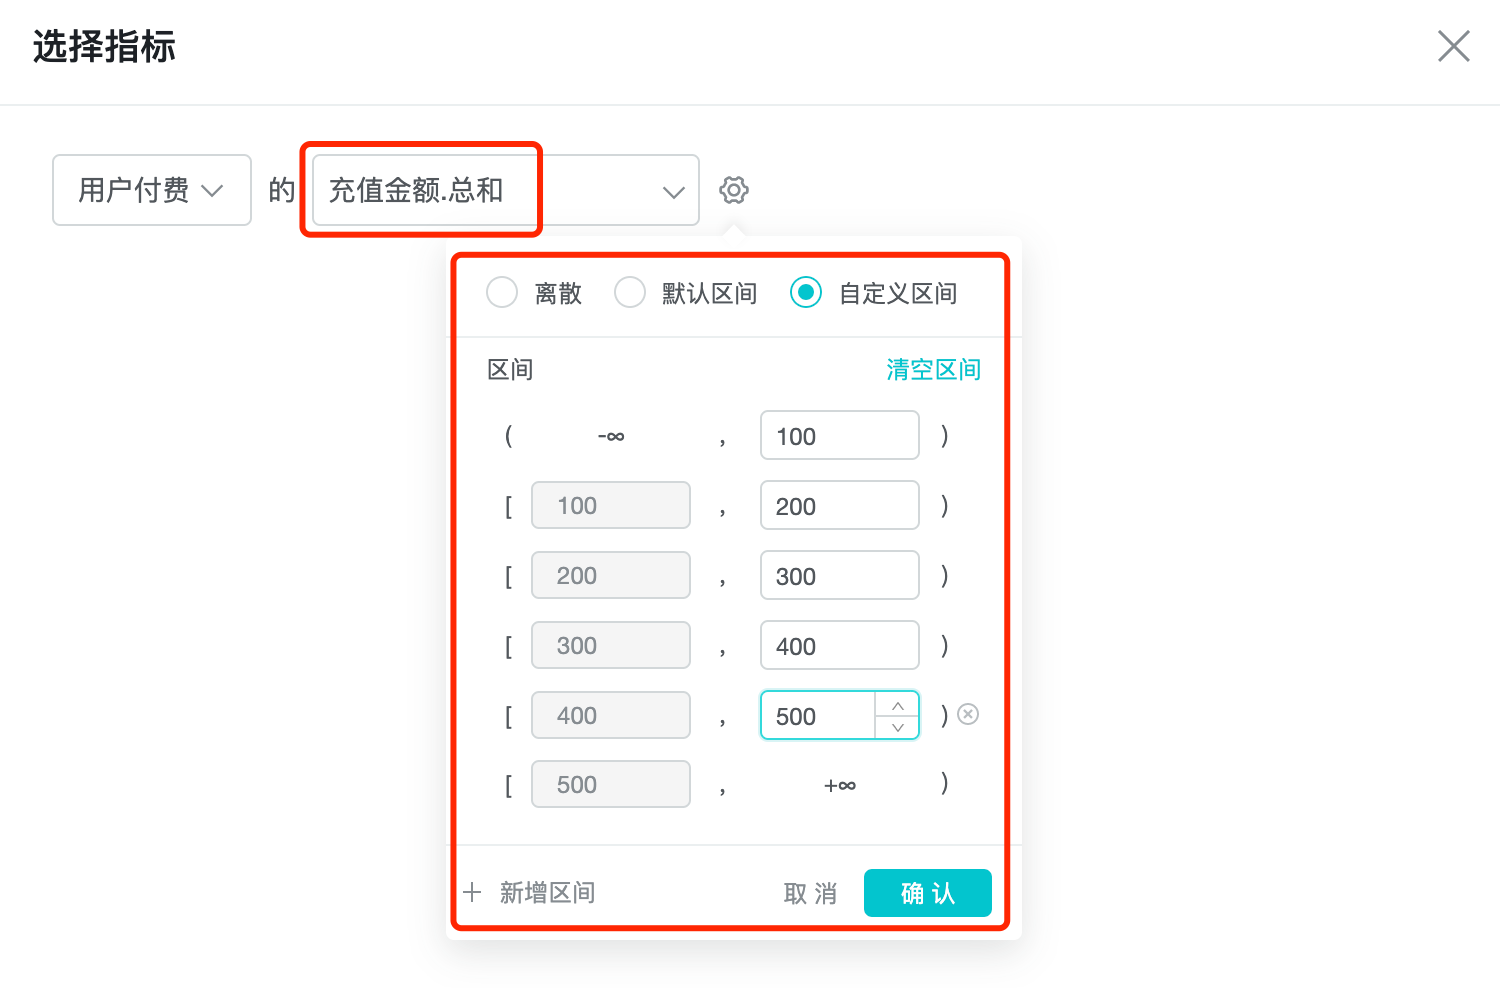
1、设置事件:我们选择事件「用户付费」,设置自定义区间,以 100 作为分段;
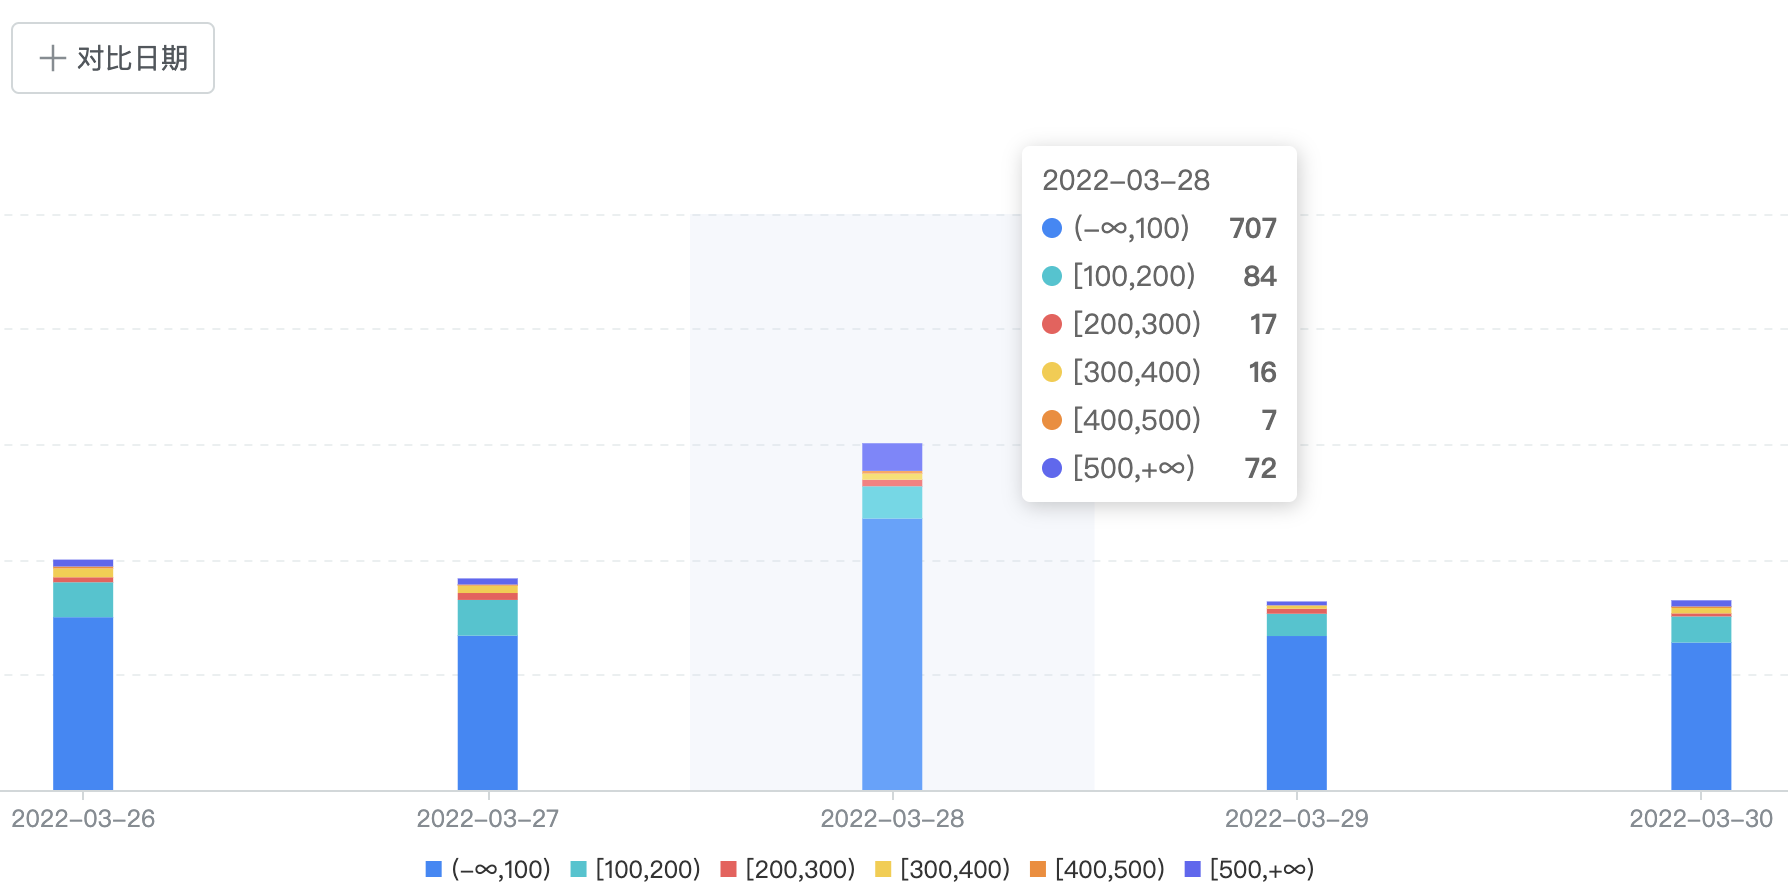
2、设置维度:我们关注的每天的金额分布变化情况,所以在维度里选择「事件发生时间」;

3、设置展示结果:设置时间段和其他参数,并点击查询查看分析结果;
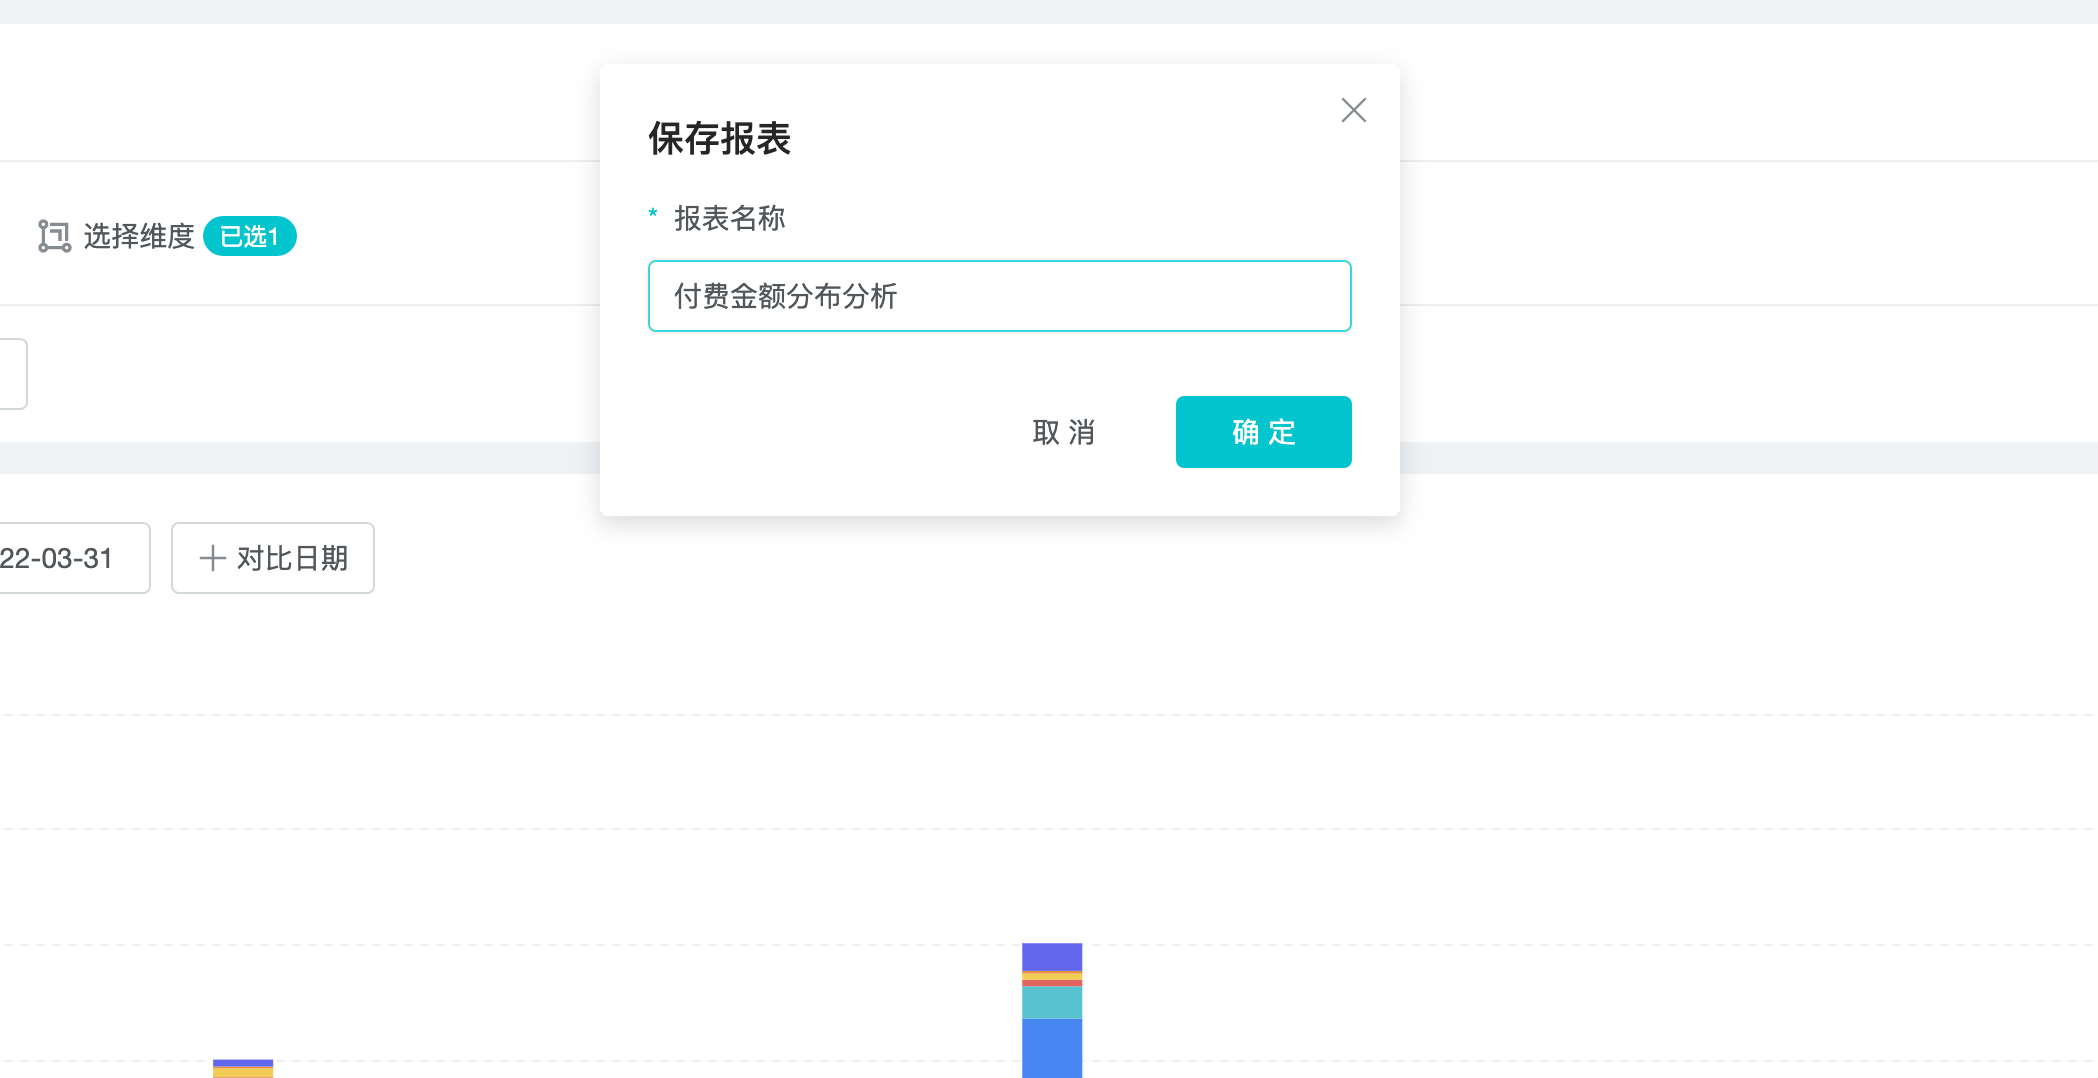
4、保存报表:将查询结果保存为报表。再将报表转变为看板,就可以每天方便快捷的看分布分析。
二、什么是分布分析
分布分析功能,主要用来了解不同区间事件发生频次,不同事件计算变量加和,以及不同页面浏览时长等区间的用户数量分布。
三、分布分析的支持场景
分布分析可以帮助揭示以下问题:
- 新版本上线后,用户每天玩游戏的次数是否增加?
- 不同广告渠道来源带来的用户,在不同金额区间,例如:0-100 元,101-200 元,201-300 元 ..., 的用户数量有什么差异;
- 不同层级的玩家(新玩家、普通玩家、重度玩家)玩游戏的时长分布有什么差异;
四、如何做分布分析
如案例所述,分布分析可以分为 4 ��个步骤:设置事件、设置维度、设置展示结果、保存报表。
后面三个步骤在事件分析里均有比较详细的介绍,所以这里重点介绍设置事件。
在分布分析页面,点击「选择指标」,可以看到「指标选择」界面。指标的具体设置方式,你可点击事件分析查看。点击「设置」按钮,可设置计算结果的展示类型「离散」、「默认区间」和「自定义区间」:
「离散」:系统将展示每个数字下的分布值;
「默认区间」:系统会根据计算结果展示默认区间分布;
「自定义区间」:你可以自己设置每个区间段的起始值和结束值;
五、分布分析的计算原理
分布分析有 2 种统计方法,按次数统计和按事件属性的统计指标:
按次数统计:统计用户在一天 / 周 / 月中,进行某项操作的次数,发生一次就记录一次。
按事件属性的统计指标统计:统计用户在一天 / 周 / 月中,发生事件的某属性的统计指标值。属性的统计指标与事件分析一致,有总和、均值、最大值、最小值、去重数。