看板
1. 概述
看板是多张报表的集合,将构建的指标、留存、漏斗等保存为报表后,可将报表添加至看板中,方便日常数据的监控。
2. 使用看板进行数据分析与协作
在该部分将以 demo 项目为例,演示从新建一个看板,到在团队中通过看板进行数据协作的全流程。
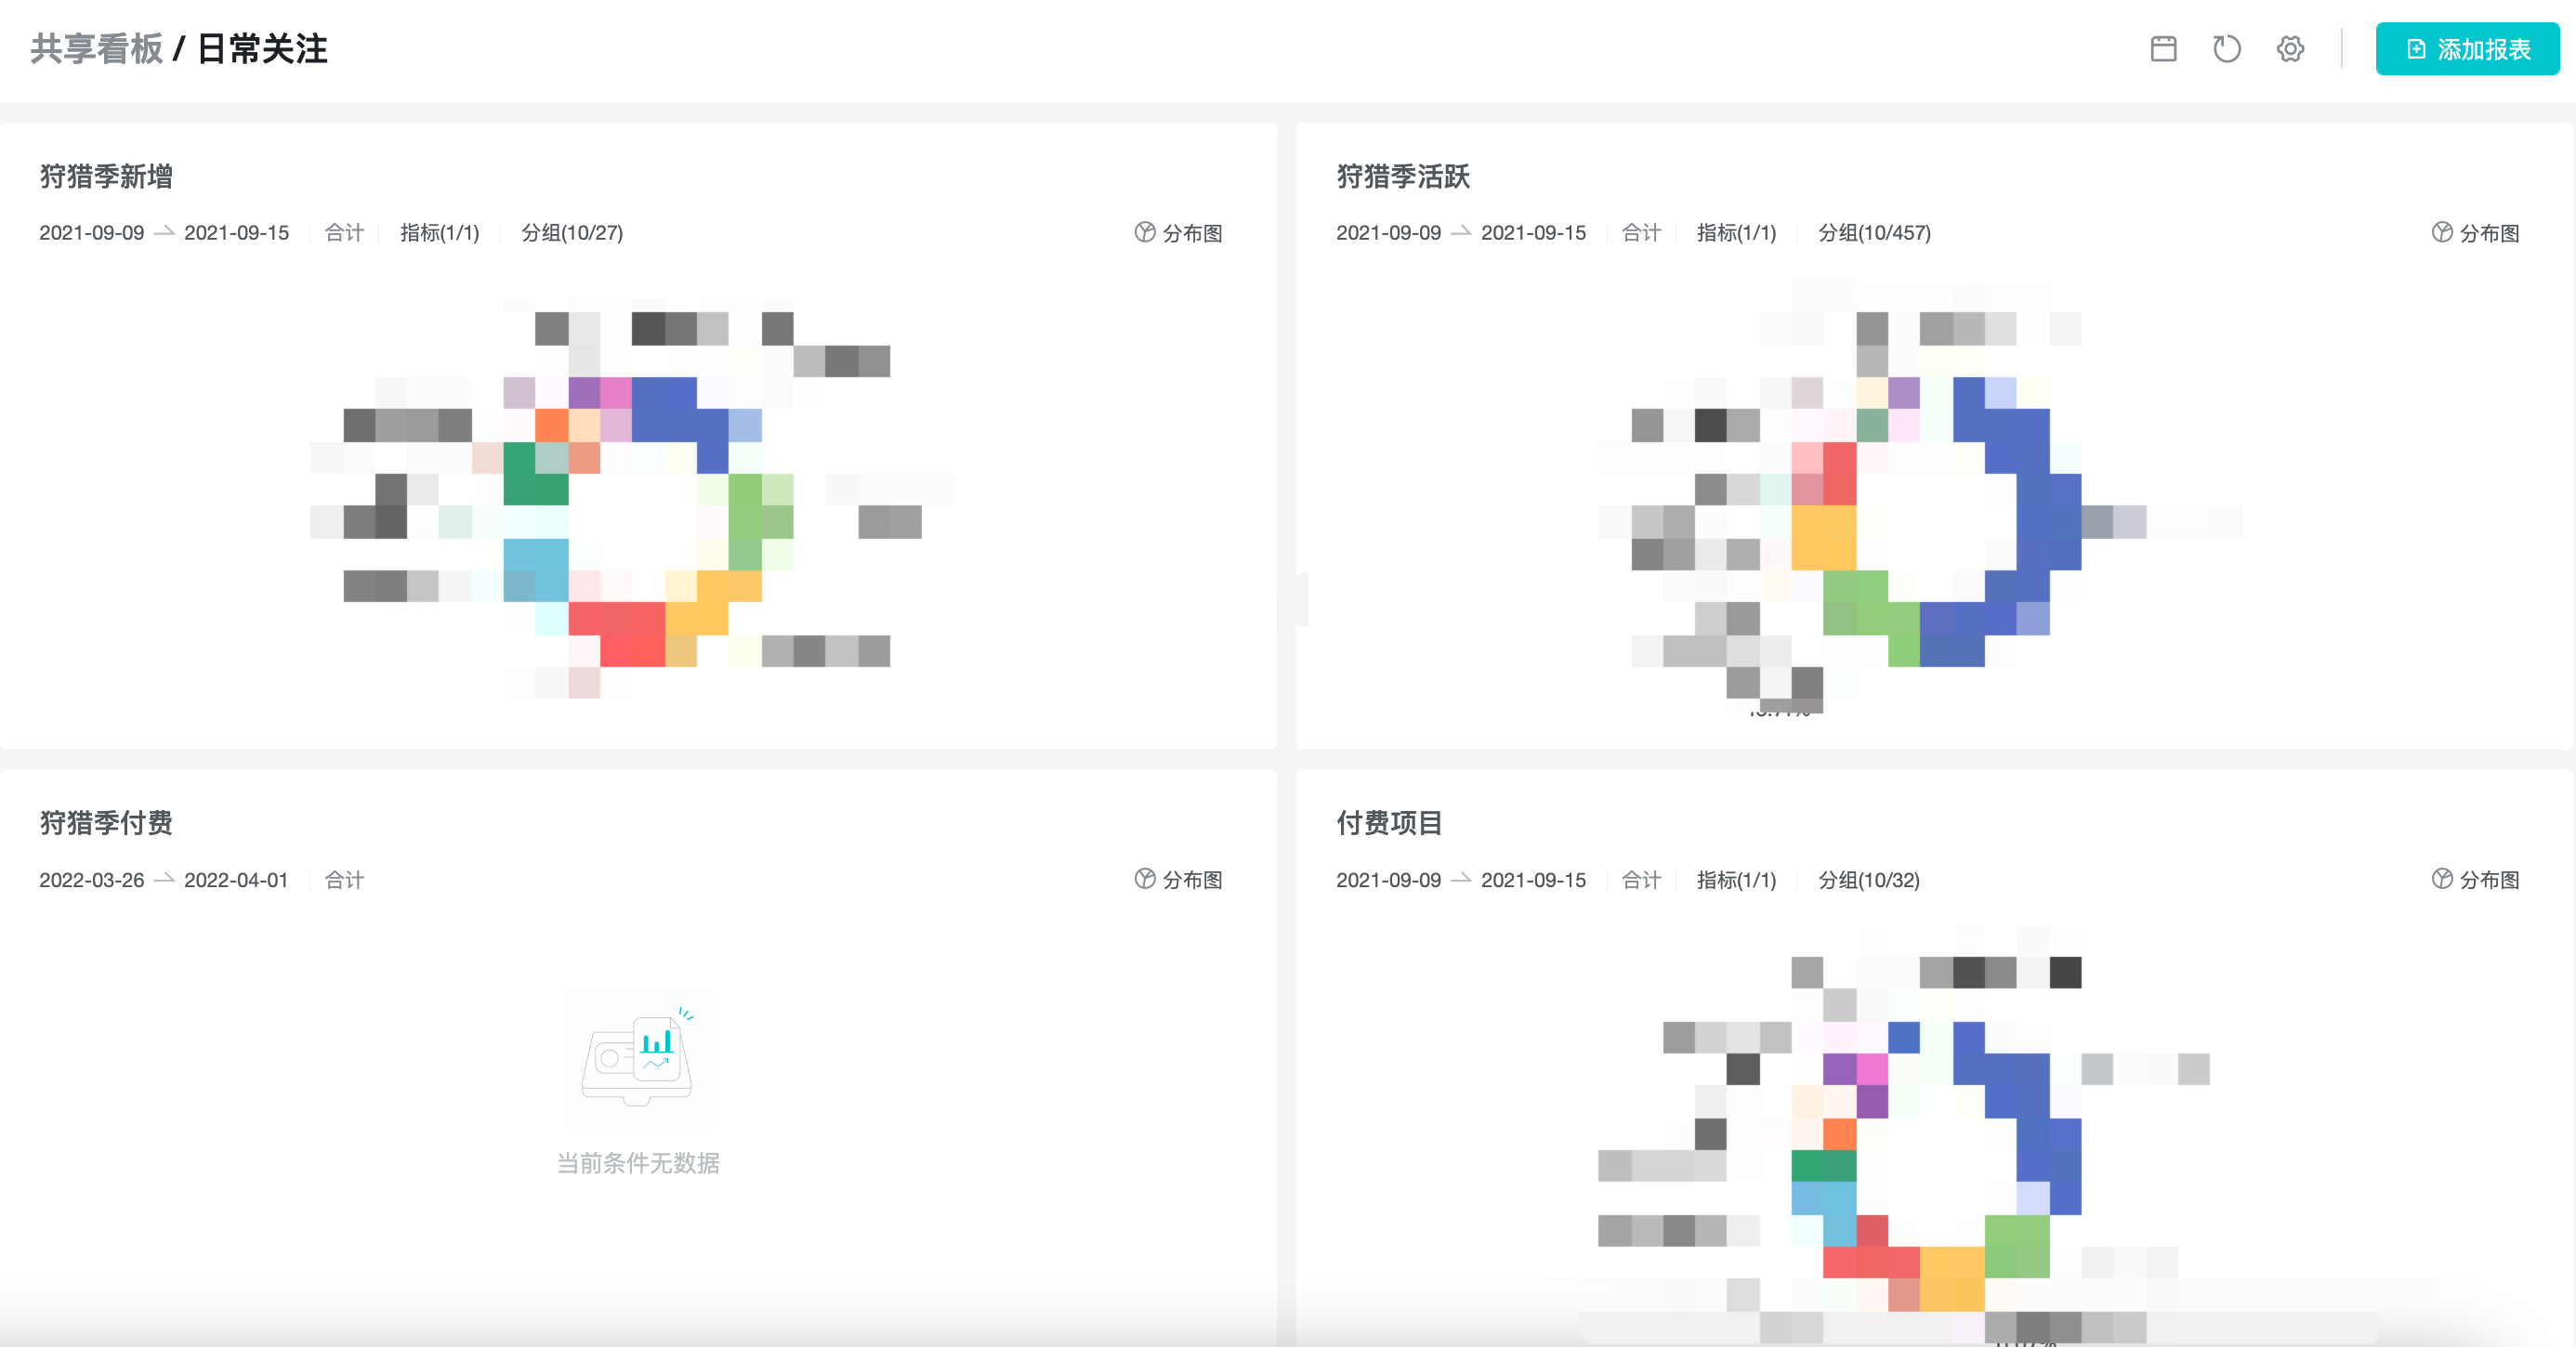
2.1 进入看板页
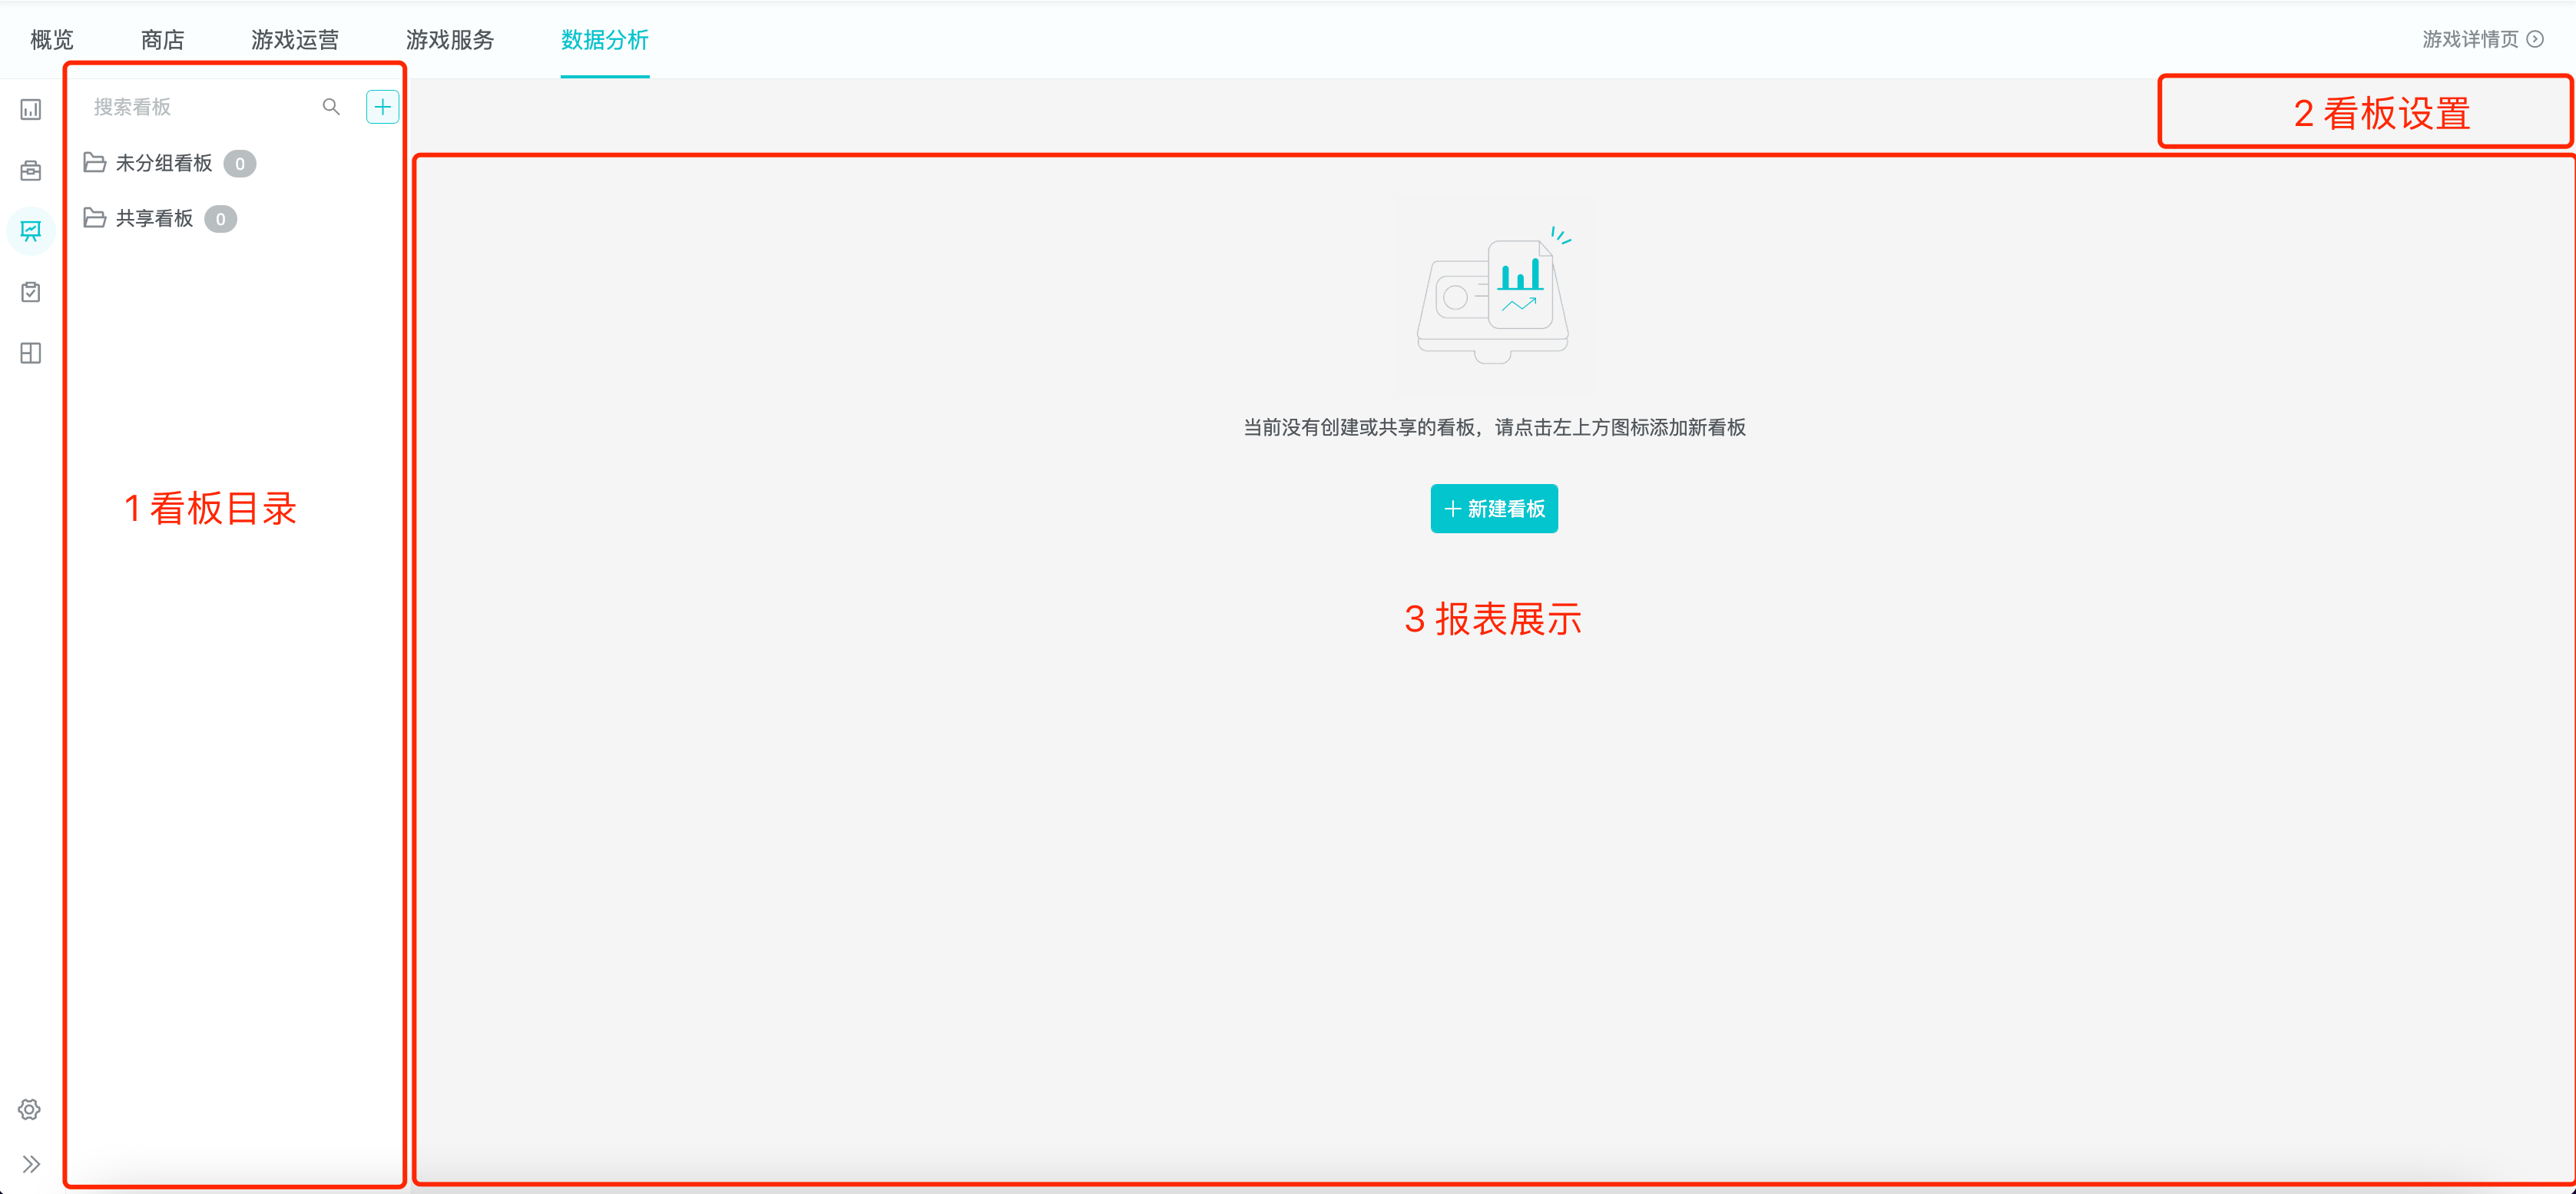
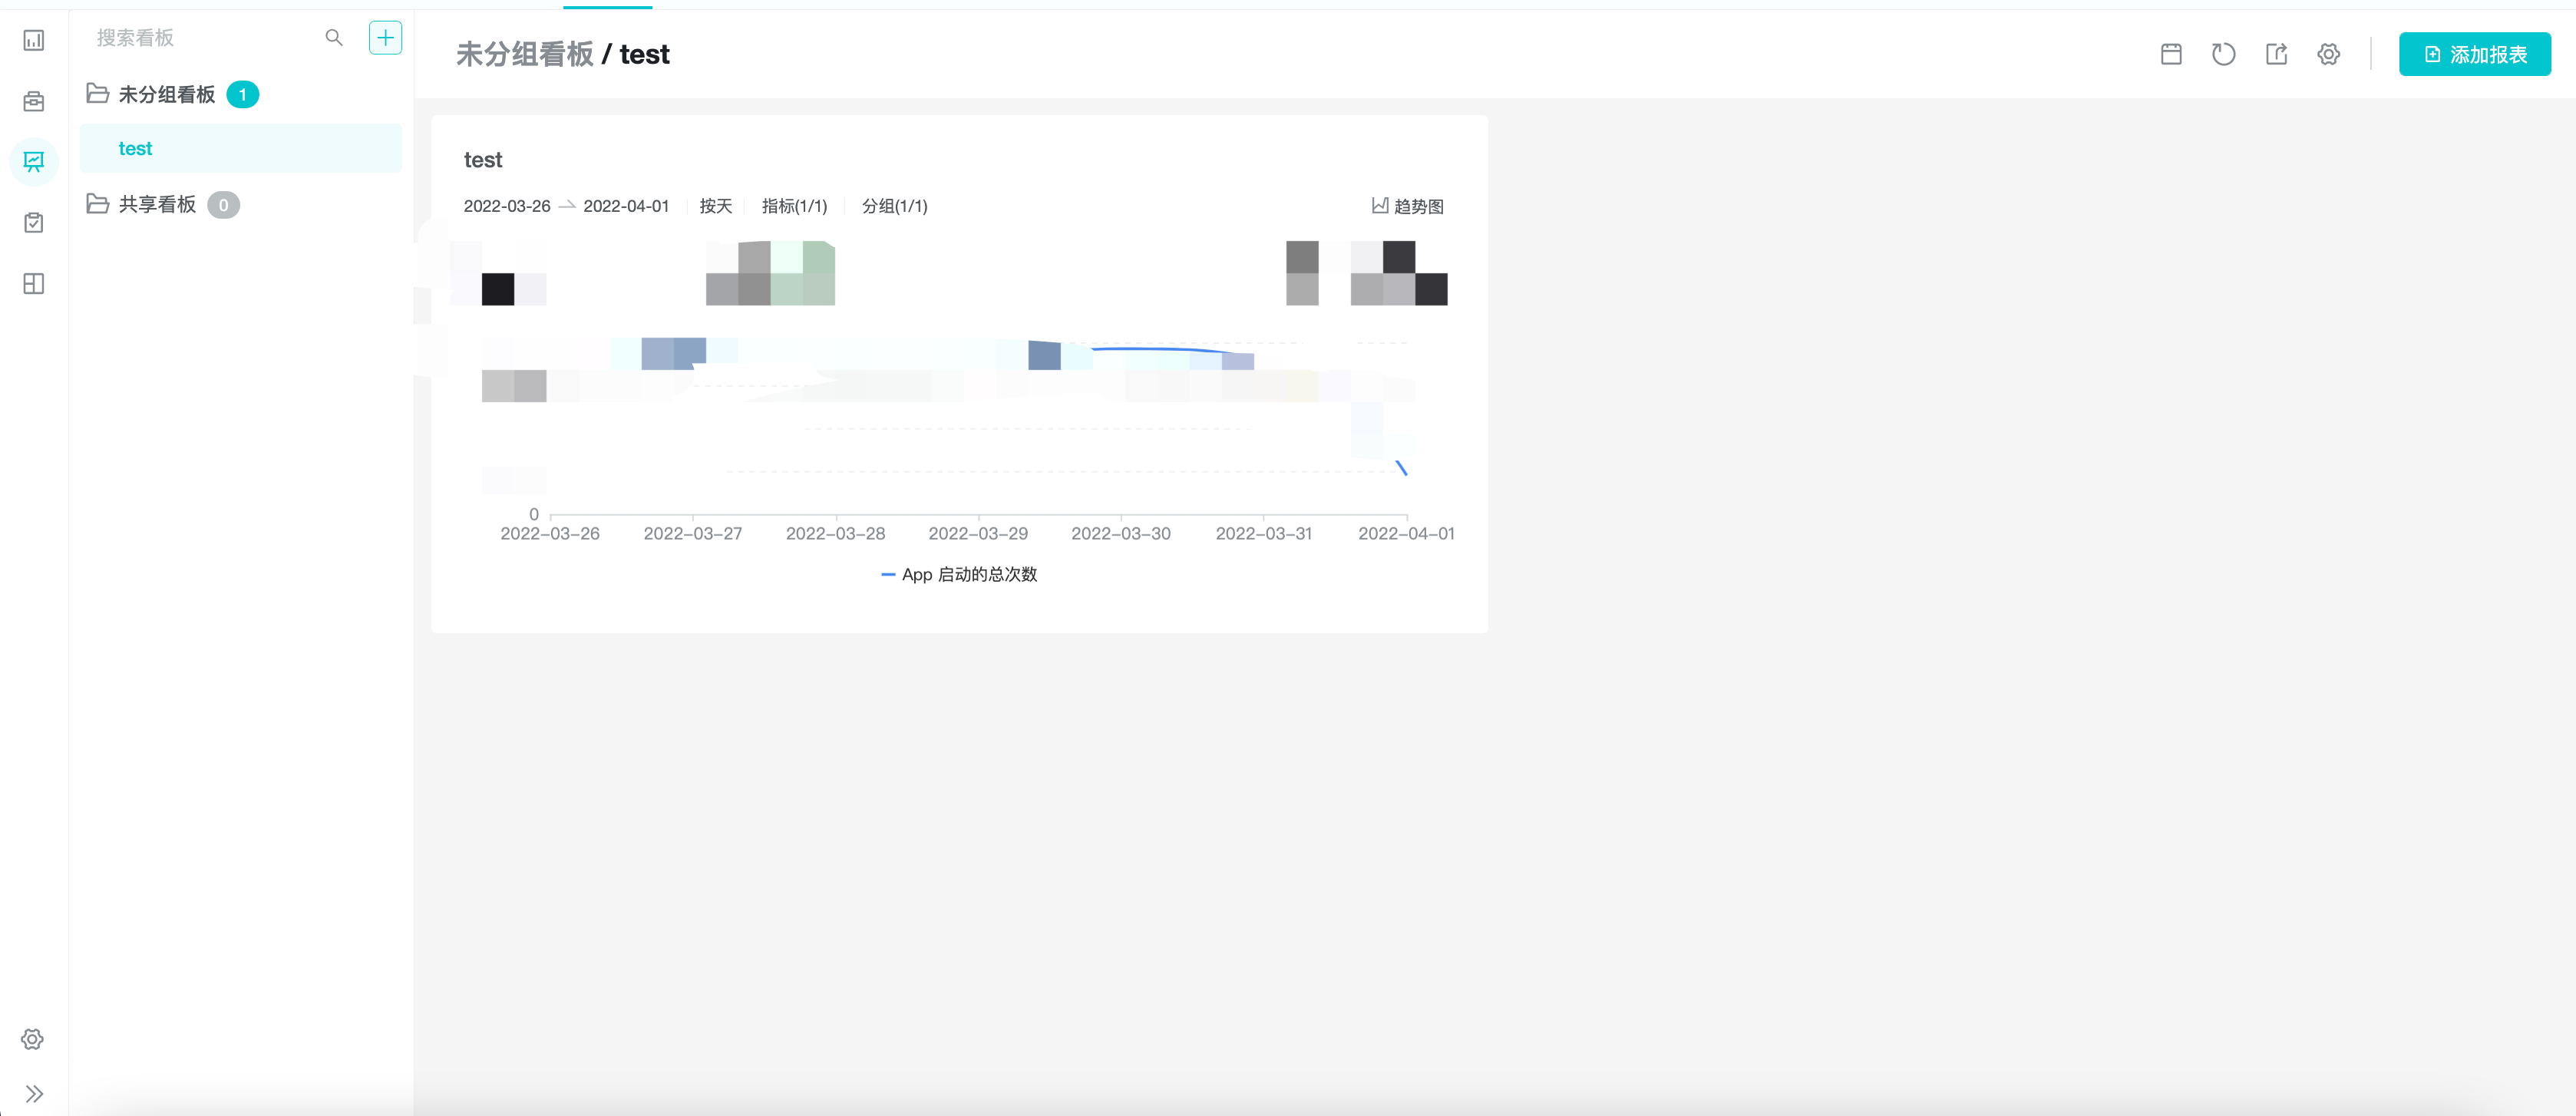
数据看板由 「看板目录、看板设置、报表展示」 三部分构成:
-
1 看板目录:创建看板 / 文件夹,查看自建看板或团队成员的共享看板;
-
2 看板设置:包括添加看板报表、设置看板共享、调整看板设置、看板刷新、为看板报表设置全局筛选等;
-
3 报表展示:展示每张看板报表的信息,支持看板报表拖拽排序,自定义大小及图表展示类型。
2.2 新建看板
现在,我们需要将一些核心指标形成日报进行每日汇报,因而决定将日常核心指标的相关报表汇总在一个看板中。

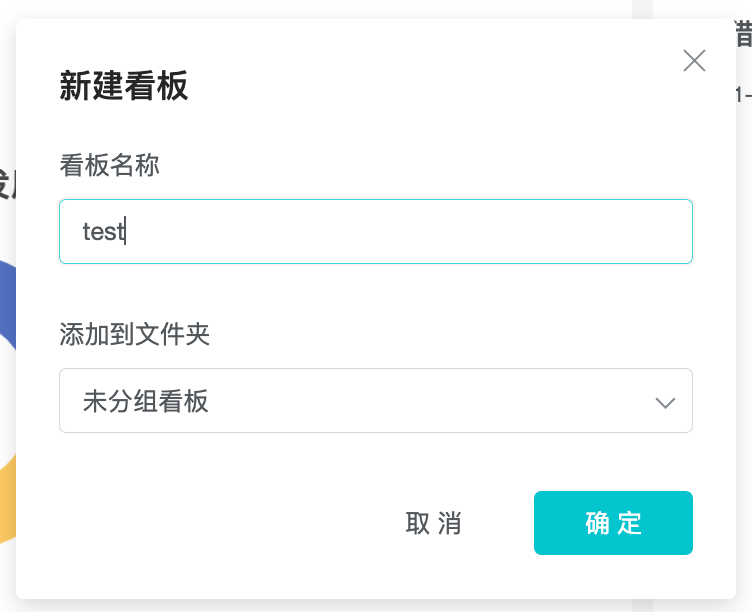
我们在看板左侧栏点击右上角「+」,选择「新建看板」,并命名为「日报看板」。
2.3 编辑、重命名、删除看板
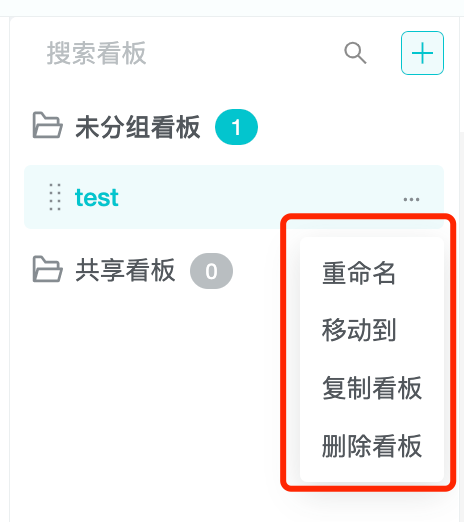
对于已经存在的看板,我们可以编辑该看板的相关信息,或删除该看板。
2.4 使用文件夹对看板进行管理
文件夹用以收纳看板,我们可新建文件夹,并进行重命名、删除,系统内置「未分组」文件夹和「共享给我的」文件夹。
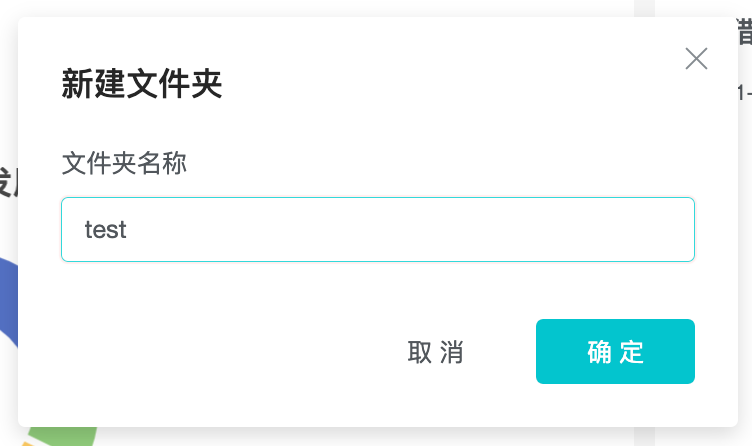
在看板左侧栏点击右上角「+」,选择「新建文件夹」,并命名为「游戏运营」,用以收纳游戏运营的相关看板。

此时,我们可以将之前新建的看板「日报看板」移动到文件夹「游戏运营」中。
2.5 将报表添加到看板
报表是组成看板的基本元素,我们可在事件分析、留存分析、漏斗分析等分析模型功能中新建报表。
为了满足日报汇报需求,我们在事件分析中构建出登录账号数、App 启动设备��数等报表,在留存分析中构建出用户 App 启动 7 日留存等报表,现在我们将这些报表添加到看板中。

点击看板右上方的「报表」按钮,点击「+」添加报表。
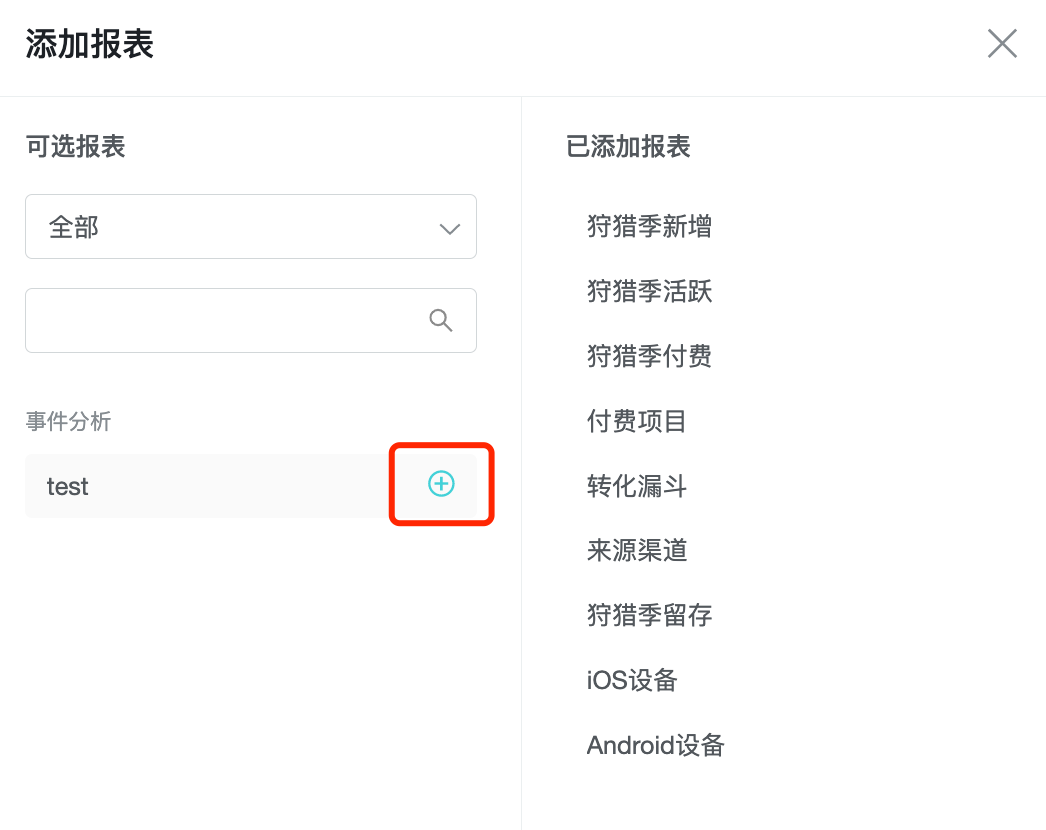
鼠标移入右侧的待添加报表中的报表行,点击「+」可将报表添加至当前看板。
2.6 设置报表
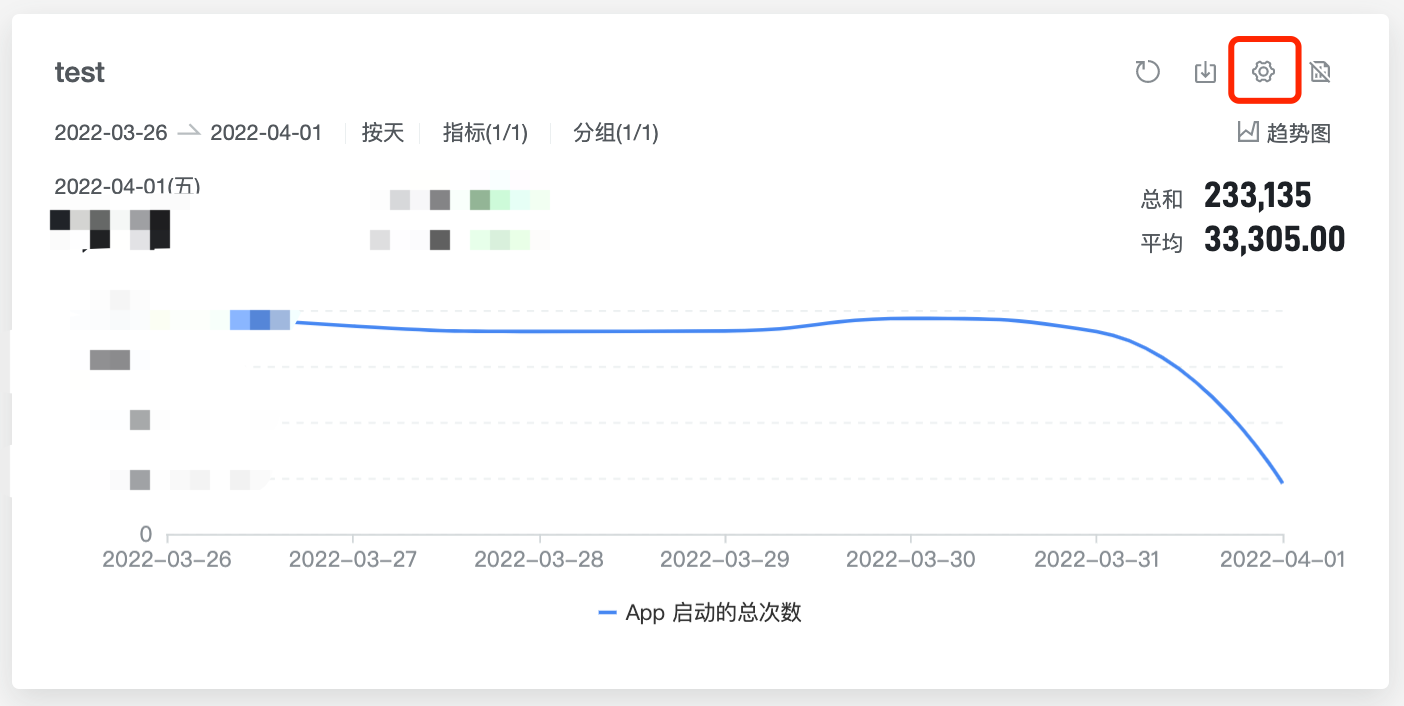
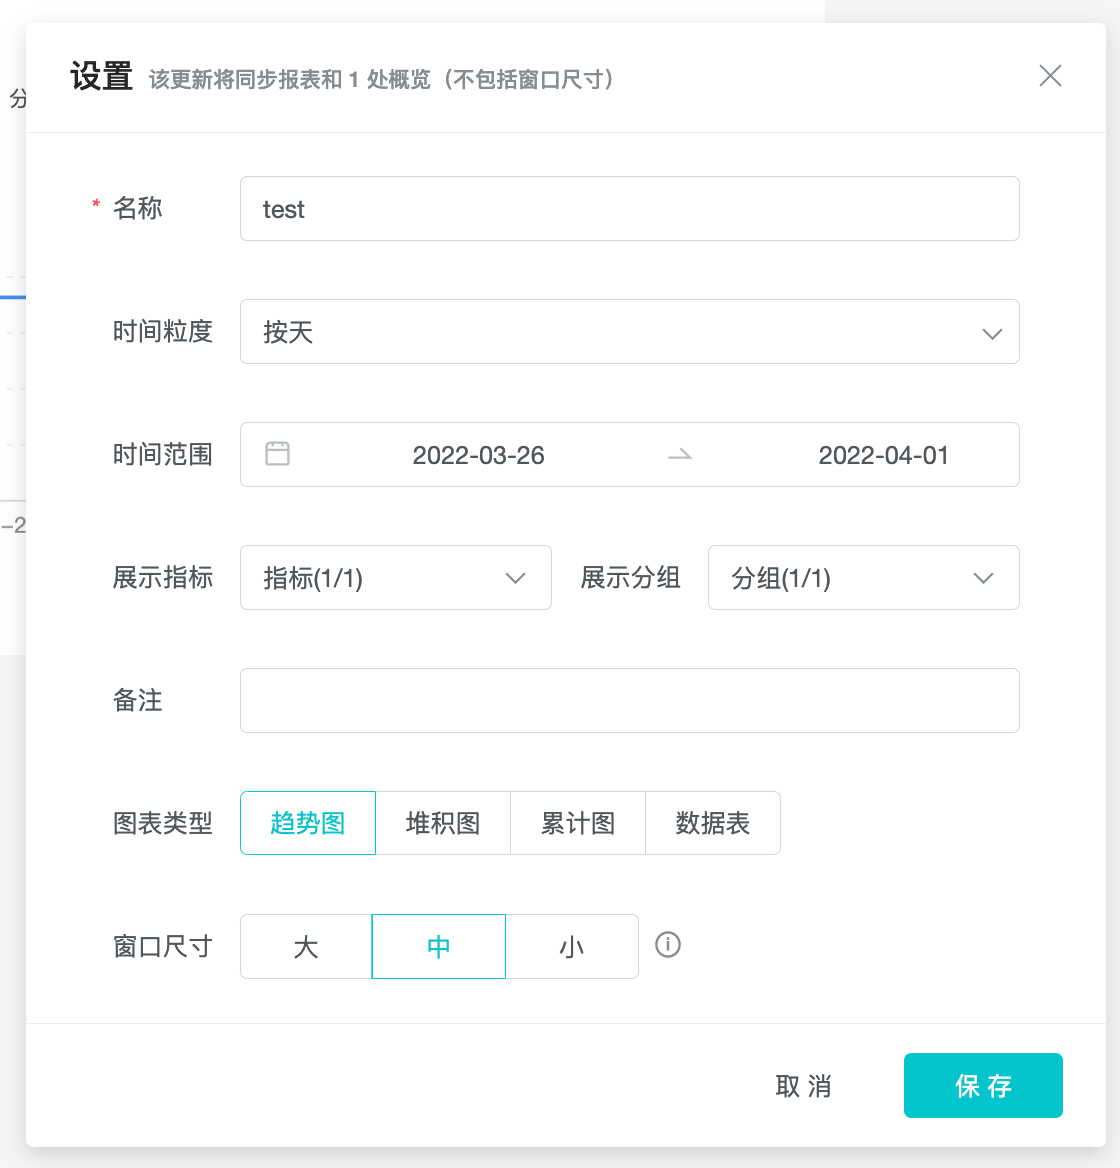
对于添加到看板中的报表,可以调整报表的大小尺寸、可视化方式、时间筛选、展示指标、展示分组等信息。
展示分组可按分组对应的指标值或分组名进行排序,并设置为选中「前 N 项目」,看板后续将根据查询时的数据进行排序并动态变更选中的分组。
将活跃账号数、活跃设备数等报表窗口尺寸设置为小,便于我们快速浏览当日的流量情况。
将「各国家活跃设备数」窗口尺寸设置为中,图表类型选择趋势图,便于观察各个国家活跃设备数在近期的变化趋势。
将「各系统活跃用户分布」窗口尺寸设置为中,图�表类型选择分布图,便于观察各个系统的用户分布。
将「App 启动 30 日留存」窗口尺寸设置为大,便于同时看到更多期群的留存数据。
2.7 设置看板
将报表添加到看板之后,我们可以对看板的更新和是否近似计算进行设置。
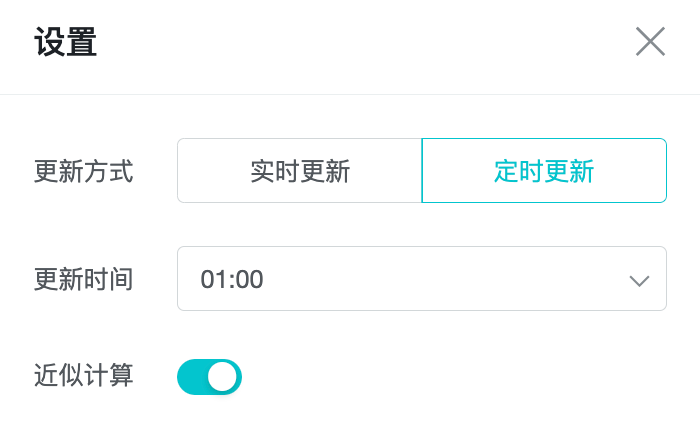
看板默认为定时更新,系统将每天定时为看板刷新计算结果,缓存该结果以便下次查看,对于看板中加载报表较多或计算量较大的场景建议打开定时更新,以提高展示效率。
看板可被设置为实时更新,即每次刷新计算时都对看板进行更新,适合需要实时刷新的指标,如当日的广告投放数据。
看板默认为精确计算,即每次计算都将按照条件算出准确值。如果对查询效率有需求,可以选择「近似计算」选项。开启后,对触发用户数、人均次数、人均值、去重数等数据,都将采取近似算法,可以极大减少性能开销并减少计算时间。
对于本次创建的「日常看板」,我们更关注近期的主要指标变化趋势,因此我们选择每日凌晨 1 点定时更新并开启近似计算。
2.8 共享看板
在工作中我们希望团队其他成员也可以查看新建的看板,甚至共同维护更新该看板,因此我们可以将看板权限共享给团队其他成员。
共享权限分为共享、可见两类,两类权限互相独立,可分别授予,用户可将共享、可见权限授予「全部用户」,任何成员加入该项目后即拥有该权限,不必频繁更新。
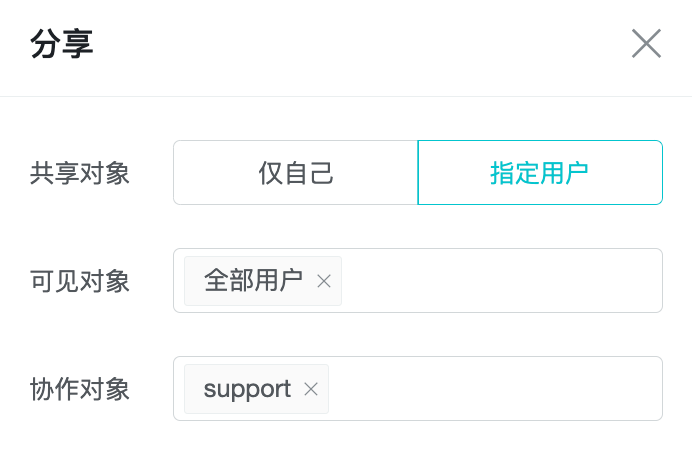
作为整个团队都关注的「日常看板」且并不包含敏感的营收等敏感收入,因此我们将可见权限授予「全部用户」,同时我们希望另一位运营同事与我们一同维护、更新该看板,因此我们将协作权限共享给该同事。
2.9 看板订阅
在某些需要定期查看数据的场景下,频繁打开看板会带来使用流程上的不便,为此我们提供「看板订阅」功能。

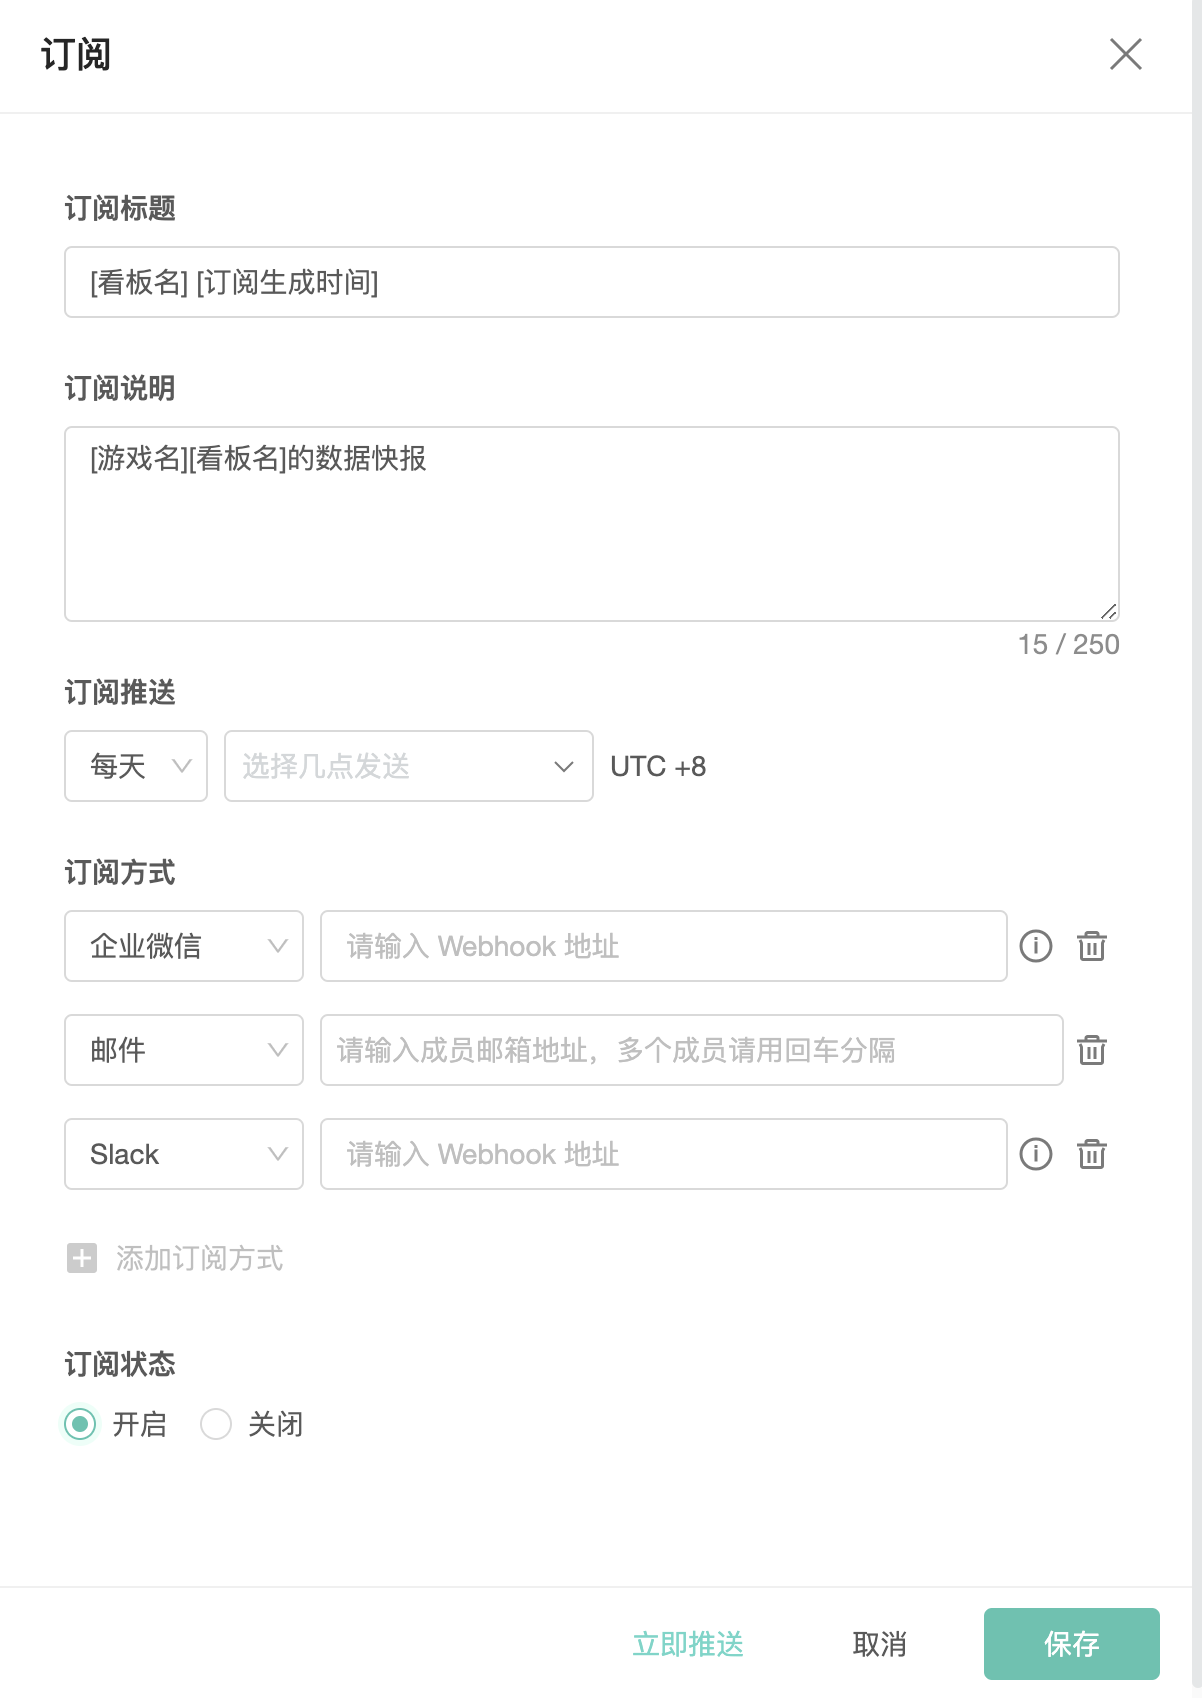
作为看板的「所有者」/「协作者」,你可以通过入口访问订阅设置界面,并基于本身业务设定订阅规则。
-
订阅标题:即此条订阅的标题内容;
-
订阅说明:即此条订阅的详细说明内容;
-
订阅推送:即此条订阅的推送时间,支持按「天」「周」「月」进行定期推送,时区固定为 UTC+8 ;
-
订阅状态:即订阅任务的当前状态,若需要暂停/开启订阅,可以手动更改状态;
-
订阅操作:除了基础「保存」操作外,可以基于当前内容「立即推送」一条订阅,用于测试验证订阅任务。
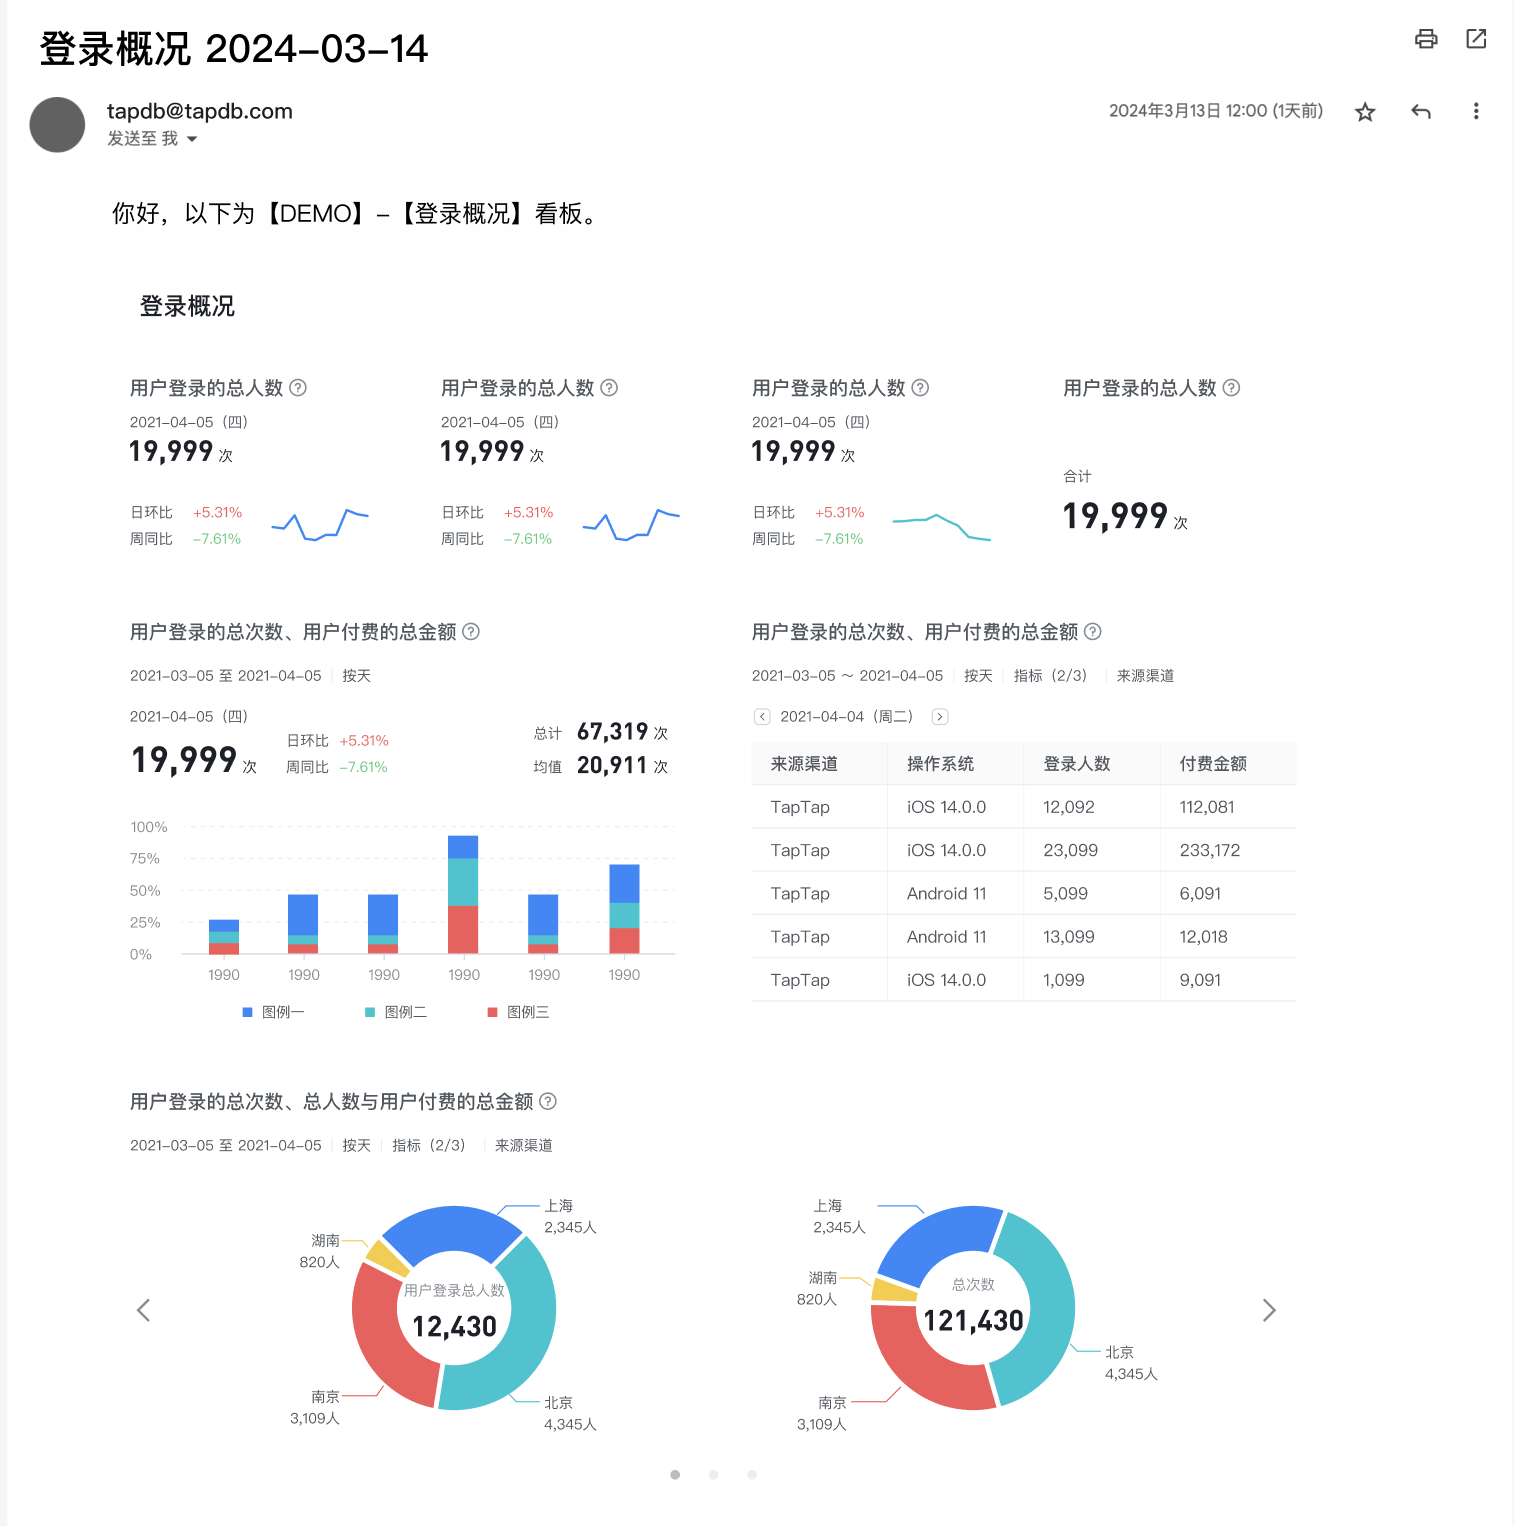
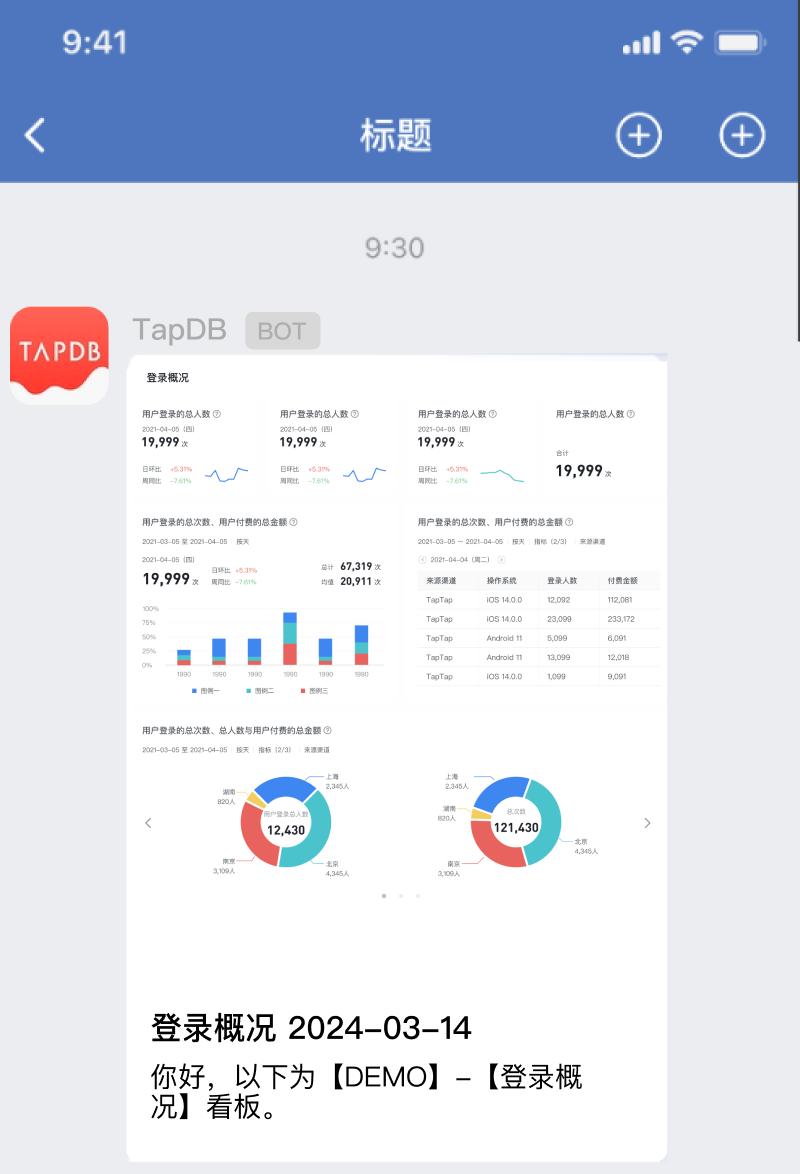
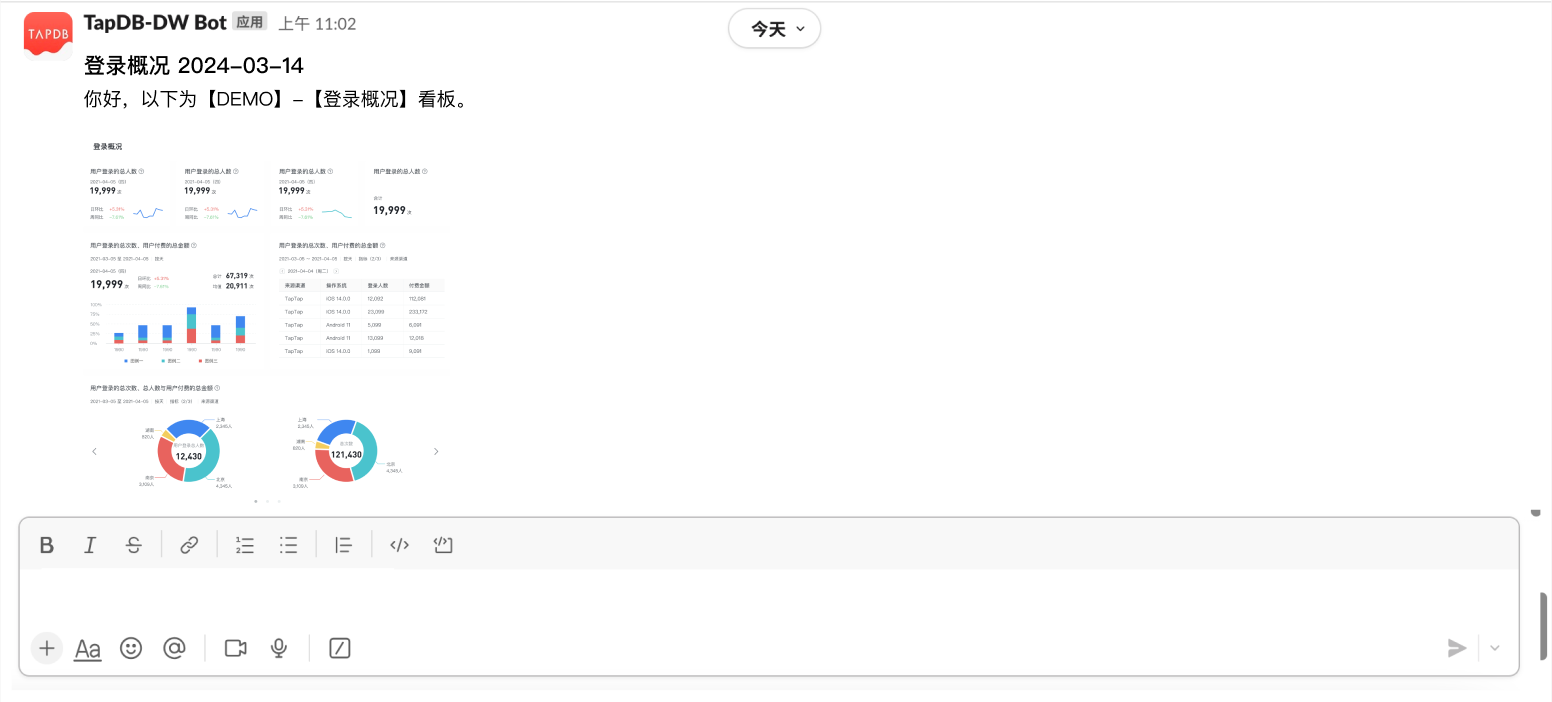
附:订阅推送效果示例图